Overall business
McDonald’s main business segments include the company operated and franchised outlets. At the moment, franchised restaurants make up 93% of the total store count, not so far off the company target of 95%. Under the franchise segment, there are conventional franchise, developmental and foreign affiliate agreements, each of which comes with a different revenue and expense structure. Below is a diagram I quickly drew to summarize McDonald’s business structure

Getting into the weed
Between the company-operated restaurants and franchised counterparts, the latter have a much higher margin

The franchised outlets posted a 82% gross margin in 2018, compared to just about 17% by the company-operated restaurants. The three-year figures also indicated the shift of focus on being a franchisor. Revenue from franchised restaurants grew on average by 8% every year from 2016 to 2018. In the same period, the domestically run outlets recorded a decline of around 19% on average every year.
The focus on being a franchisor is also reflected on the lease agreements that the company has
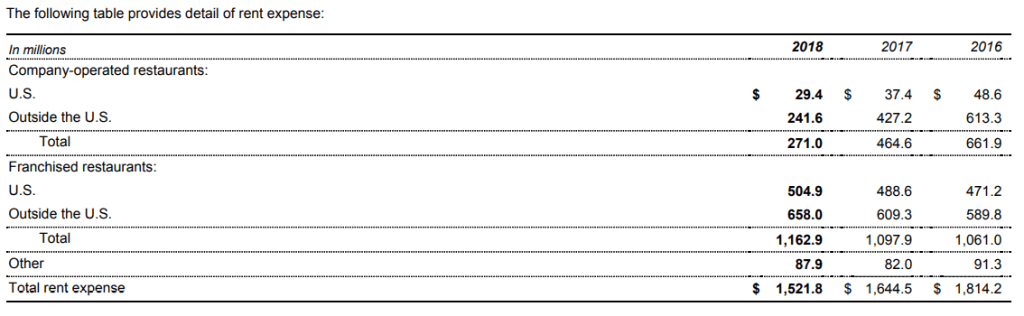
In 2018, the company was on the hook for smaller rent expense at company-operated restaurants than at franchised outlets.
McDonald’s defines its main geographical segments as follows:
- U.S. – the Company’s largest segment.
- International Lead Markets – established markets including Australia, Canada, France, Germany, the U.K. and related markets.
- High Growth Markets – markets that the Company believes have relatively higher restaurant expansion and franchising potential including China, Italy, Korea, the Netherlands, Poland, Russia, Spain, Switzerland and related markets.
- Foundational Markets & Corporate – the remaining markets in the McDonald’s system, most of which operate under a largely franchised model. Corporate activities are also reported within this segment.
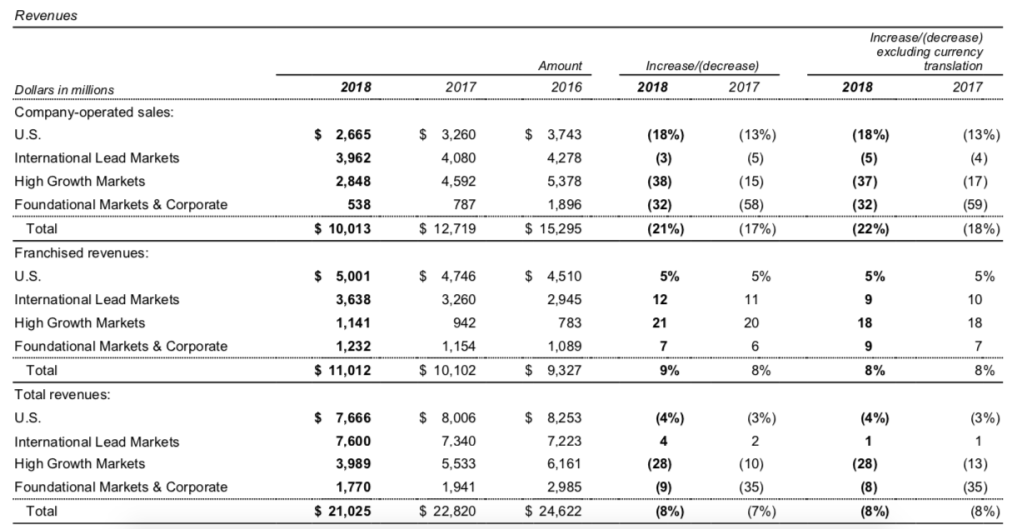
Systemwide revenue has been decreasing since 2016. The main reason for the decline was attributed to company-operated segment as it shrank by 21% and 17% year over year in 2018 and 2017 respectively. Additionally, the chart showed that International Lead Market was the only segment that registered revenue growth in 2018. High Growth Market delivered the biggest growth in franchised revenue, but also the biggest decline in company-operated revenue. Concerningly, the high growth market segment registered a decrease in revenue while it should have been the opposite, essentially due to the decline in company-operated revenue.
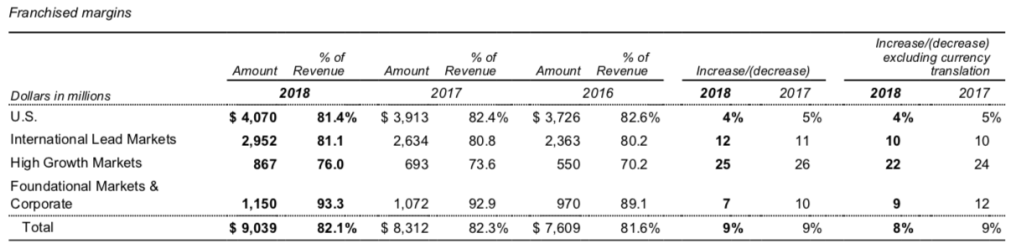
In terms of operating margin, Foundational Markets led the way in the franchise department while International Lead Markets took the top spot in the company-operated one.

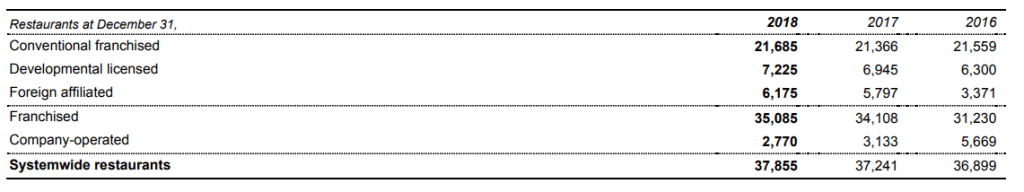
Regarding restaurant counts, systemwide restaurant count went up compared to 2017, but presence in the US shrank.
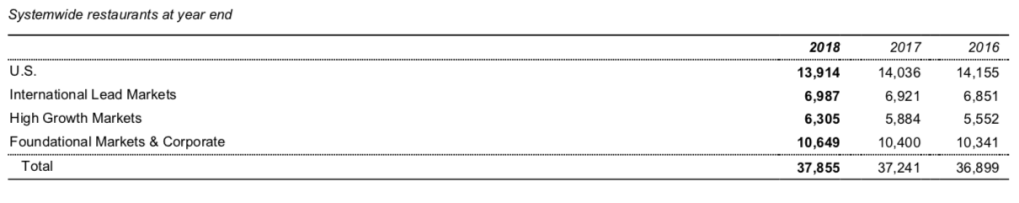
It’s helpful when the company gave more color on the company-operated/franchise breakdown of the store count.
Approximately 93% of the restaurants at year-end 2018 were franchised, including 95% in the U.S., 88% in International Lead Markets, 83% in High Growth Markets and 98% in Foundational Markets.
Source: McDonald’s
It is very interesting that the net restaurant addition in 2018 was bigger than that in 2017, but the company added smaller initial fees in 2018 and bigger revenue from rent and royalties than in 2017.
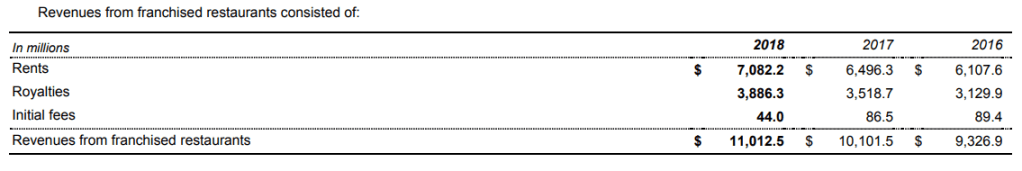
The most likely explanation I could come up with is that the company gave quite a haircut on the initial fees for new restaurants in High Growth Markets (see the breakdown a few paragraphs down).
The timing of new and closed restaurants varied from one market to another and it made the calculation of average revenur or sale per restaurant tricky. Nonetheless, if we can make simple assumptions and take the revenue as well as restaurant count at year end, we can compare 2018 vs 2017 to see where the business is going

Regarding the US, compared to 2017, average sale and revenue per company-operated restaurant decreased in 2018 while both average revenue and sale per franchised restaurant increased.
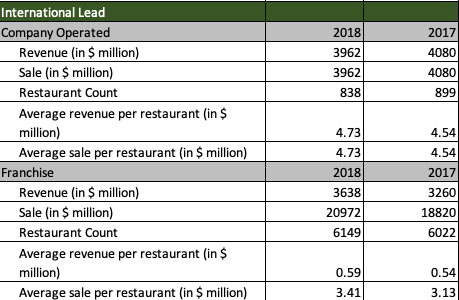
For International Lead Markets, compared to 2017, average revenue and sale per restaurant increased for both company-operated and franchised outlets.
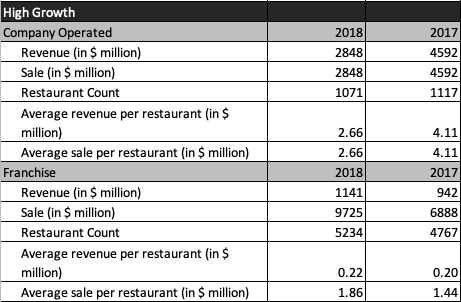
The situation in High Growth Markets is similar to that in the US. Average revenue and sale per company-operated restaurant decreased significantly.

Foundational Markets mirrored what happened with High Growth Markets.
In terms of ownership type, conventional franchise is the biggest source of revenue, followed by developmental licensed and foreign affiliate. However, foreign affiliate grew the most in 2018 compared to 2017, by 6.5%, followed by developmental licensed with 4% and conventional franchise with 1.5%.
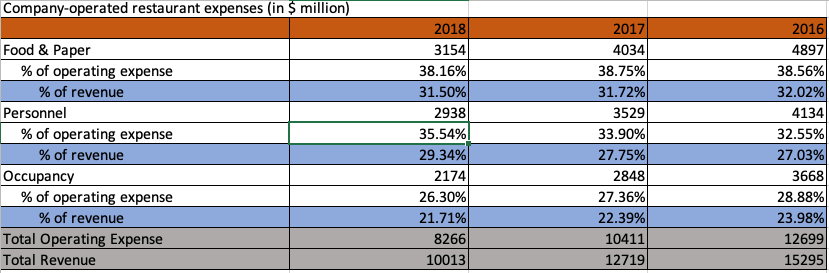
When looking at the expense structure for company-operated restaurants, food and paper is the biggest piece of the pie, even though personnel registered the biggest growth YoY compared to 2017.
Above is just my analysis for the operating side of McDonald’s based on its last two annual reports. There is a lot more to look at such as the cash flow, the financing and investing activities. I hope that you found something useful in this entry.

Leave a comment