On 6th February 2020, Uber announced its Q4 FY2019 earnings. Below are some of the thoughts I had from reading their press release
Take Rate
Uber defines take rate as the result of adjusted net revenue divided by gross bookings. In a layman’s terms, it is the amount of Uber takes from what riders pay for rides, after paying drivers their share. In Q4 2019, the take rate reached 20.6% compared to 18.7% in Q4 2018. It meant that out of $100 taken from riders, Uber took in more money in 2019 than in 2018
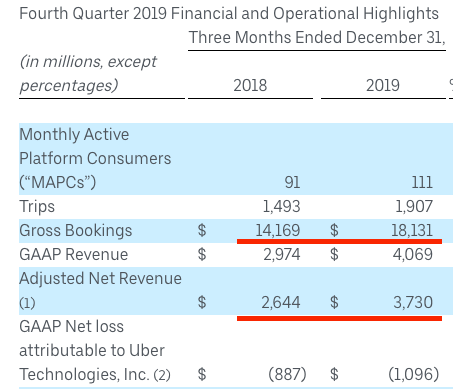
However, if we look at 2019 as a whole, take rate dropped to 19.8%, compared to 20.7% in 2018, almost a full 1% lower.

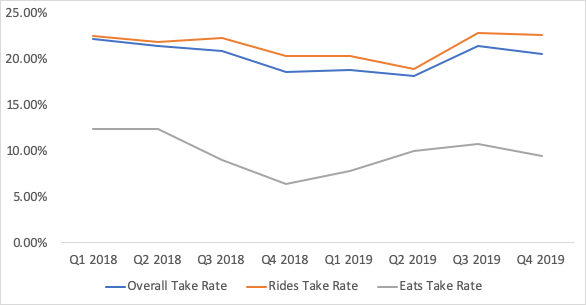
Overall, in the second half of FY 2019, Uber had higher take rates overall, for Rides and for Eats individually than in the second half of FY 2018. However, the gain was sufficient to make up for the deficit of the first half of FY 2019 to the first half of FY 2018. As you can see from the graph above, Eats provided a terrible take rate, compared to Rides.
Driver Incentives and Driver Referrals
The incentives and referrals help reflect the health of the brand and business. Low payout for incentives and referrals means that Uber spent less money to recruit drivers and increase rides. Incentives and referrals are usually presented in this manner by Uber

I calculated the ratio of Adjusted Net Revenue (ANR) over revenue in 2018 and 2019 for both Rides and Eats. The higher the figures, the better for Uber

Apparently, it keeps getting better and better for Rides. On the Eats side, Uber seemed to recover from the slump in Q3 and Q4 2018.
Rides
Rides continues to be the silver lining in the EBITDA area for Uber. It is the only segment with positive EBITDA in Q4 2019 or FY 2019 as a whole.

It’s even better for Uber that YoY growth for Rides EBITDA (34%) is bigger than that for Rides Bookings (18%), Revenue (27%) and ANR (30%).
Eats
Eats registered the biggest loss among Uber’s segments in Q4 2019. Uber may find it encourage the fact that Eats’ Q4 loss is only 111% of ANR, compared to 168% in the same period last year.
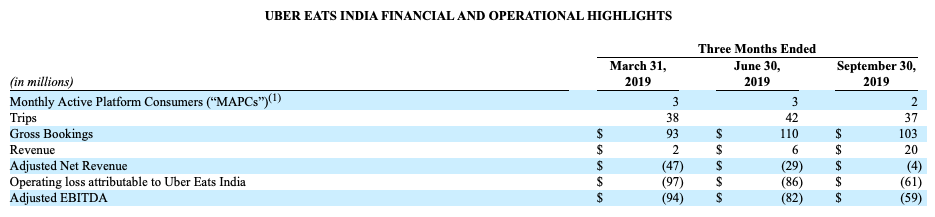
Uber recently announced the divestiture of Uber Eats in India. Since Uber Eats was losing money and users in India, the decision looked a wise one and in line with the strategy pursued by the company.
CEO of Uber revealed on the earnings call that Uber Eats in the US made up almost 39% in gross bookings of the global Eats GB ($1.7 bn out of $4.374 bn). There are 400,000 active restaurants in the US on the Eats side, up by 78% YoY.
Freight
Freight’s Q4 loss was a tad more than 25% of its ANR, compared to a bit more than 18% of the same period last year. Not a trend that Uber would want in their quest to become profitable.
Cost structure

On a full year basis, only depreciation as % of revenue decreased in 2019, compared to 2018. Overall, operating cost and expenses increased significantly in 2019, reaching 161% of revenue in 2019. However, Q4 2019 provided a brighter picture for Uber. Only R&D as % of revenue went up in the quarter, compared to the same period last year, especially given that operating expenses as % of revenue in Q4 2018 were higher than those of FY2018.
Good bits of information here and there
- Uber for Business’ Gross Bookings made up 9% of the total GB
- In Q4 2019, Uber Rewards Program had 25 million subscribers from multiple markets, up from 18 million from the US alone reported in Q3 2019
- Multiple-app users had almost 3 times the number of transactions as single users

Thoughts
Though challenges remain, including those posed by local authorities threatening to impose infavorable regulations, driver/rider safety and competition, Q4 2019 seemed to offer the team at Uber and bull investors something to be optimistic about.
In an ideal world, I would love to see more transparency regarding:
- Margin of products such as Uber for Business, Airport, Helicopter, Comfort, Scooter
- Margin of Eats in the US or products in the key market
- More details on subscriptions
- Engagement data regarding the use of multiple apps per user

Leave a comment