This is a little personal project, using Tableau to visualize the data from Artificial Intelligence Landscape in 2018 by Asgard. All copyrights related to the data are owned by Asgard. I just applied some simple analytics and visualization.
I tried to embed the code from Tableau, but I’d have to upgrade my WordPress plan to Business in order to do so. A bit of a bummer. Nonetheless, here are a few insights

Above is a diagram of the top 10 industries by the number of AI companies. Communications, Sales & Marketing and Healthcare make up the top 3.

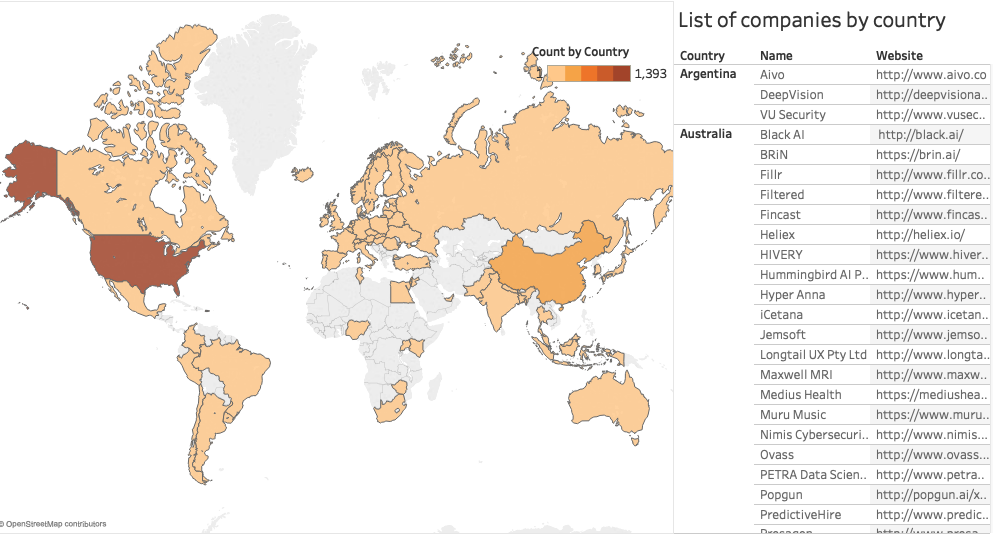
On a global level, the US dwarfs every other country in terms of the number of AI companies. It has more AI companies than the next 6 countries combined.
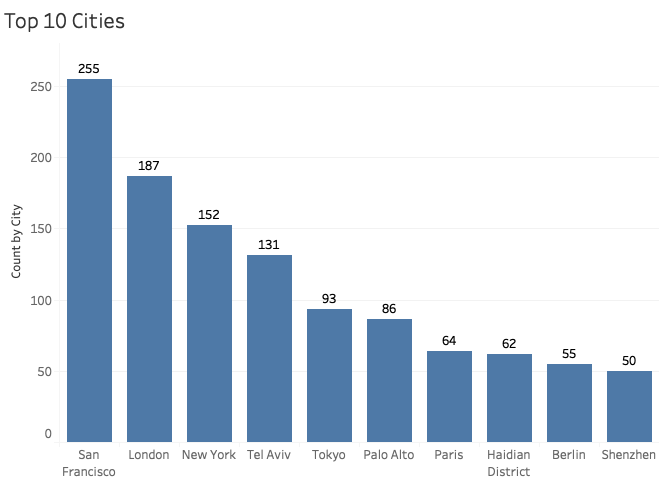
Above are the top 10 cities by the number of AI companies. San Francisco, London and New York make up the top 3. The numbers by city on my dashboard differ from those presented by Asgard itself. The difference, I suspect, comes from the way cities are grouped. I didn’t do any grouping. All visualizations come straight from the data itself while I suspect that there must have been some grouping by Asgard. Nonetheless, the figures by country present no difference.
On my dashboard, users can click any country on the map to filter out the list of individual companies within that country. Furthermore, users can see the top 10 industries by country as well.
My Tableau dashboard can be found here.

Leave a comment