The data from this Story is from 2014 to October 2018 and taken from Singapore Tourism Board website. You can find my Tableau dashboard here.
Accumulative figures for available room nights, booked room nights, revenue, average room rates and RevPar are on a monthly and yearly basis.
Drilling down further, hotel statistics are categorized by four hotel tiers: luxury, upscale, mid-tier and economy. Since segment data is available only in RevPar, average room rates and occupancy rate, it’s not possible to compute the accumulative figures for segments.
Basic terminologies:
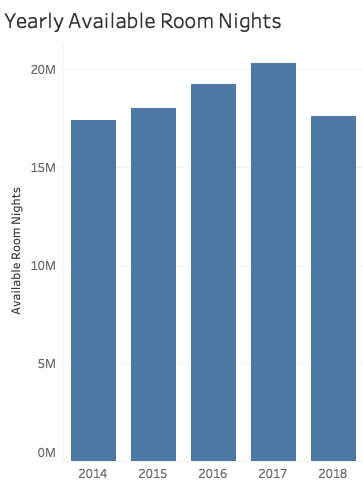
Available room nights refer to the total possible number of room nights in a period of time.
Booked room nights refer to the total number of room nights booked by guests in a period of time.
Average room rates refer to the average revenue per booked room nights in a period of time. It’s calculated by revenue divided by the number of booked room nights
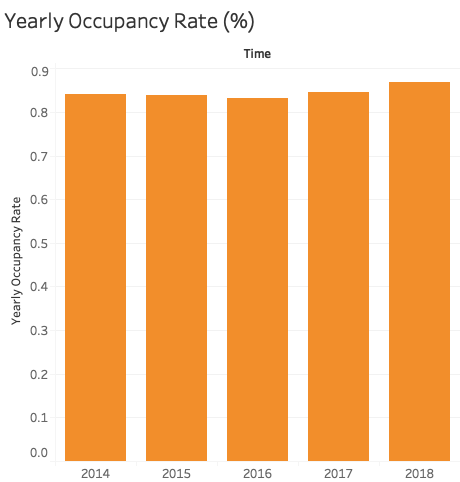
Occupancy rates refer to the percentage of booked room nights against the available room nights. It’s calculated by booked room nights divided by available room nights
Revenue per Available Room or RevPar refers to the revenue per a room night. It’s one of the most important metrics in the industry, showing how a property fills its room inventory and how much it can charge per room. It’s calculated by Occupancy Rate multiplied by Average Room Rates in the same period of time.
Insights
Yearly Statistics
From 2015 to October 2018, the Singaporean tourism industry averages more than 80% in occupancy rate; which is pretty positive
The industry seems also to be on expansion with increasingly bigger yearly available room nights (almost 3 million room nights from 2014 to 2017) & booked room nights

While the number of rooms and occupancy rate get increasingly bigger year after year, the average room rate and RevPar go in the opposite direction
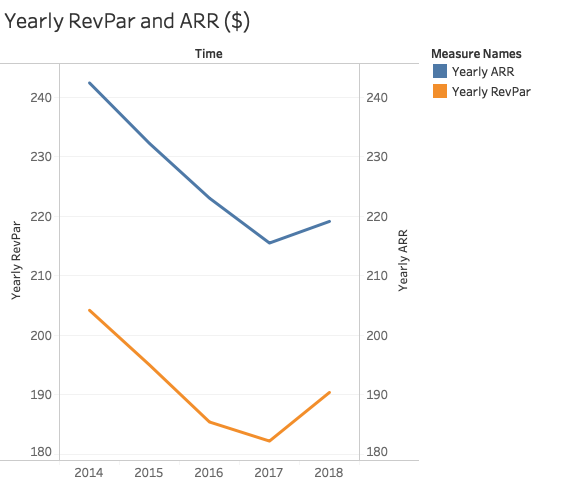
The rise in revenue signals that the increase in available & booked room nights outweighs the drop in average room rates and RevPar

Data in 2018 doesn’t include figures in November and December. Given the past performances, it’s difficult and uncertain to predict how the average room rates and RevPar will fare. It seems; however, average room rate will go up in December, compared to the rate in November.
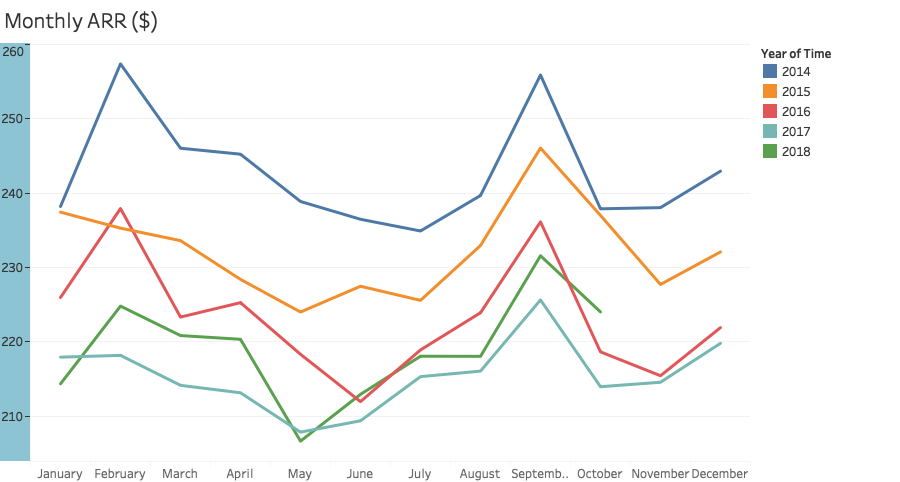
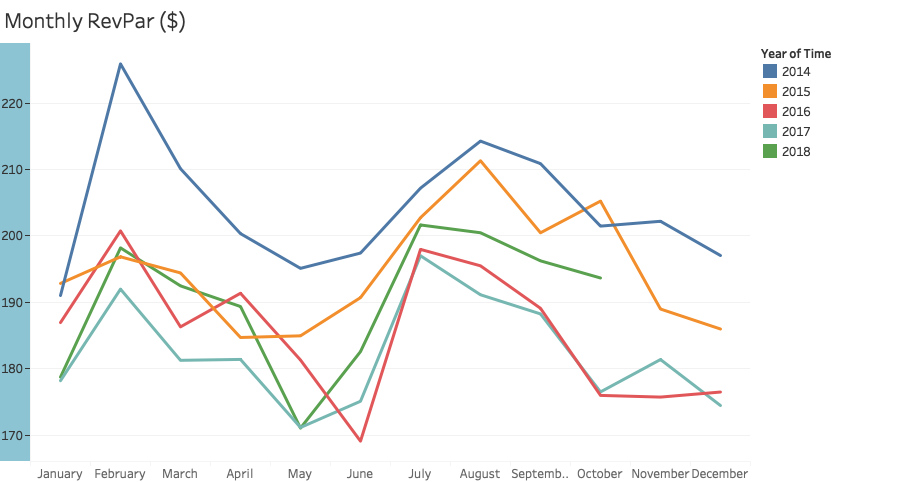
Also, December seems to be a low month for Singapore’s tourism as historical figures show below. On the other hand, July and August are the busiest months of the year for Singapore.

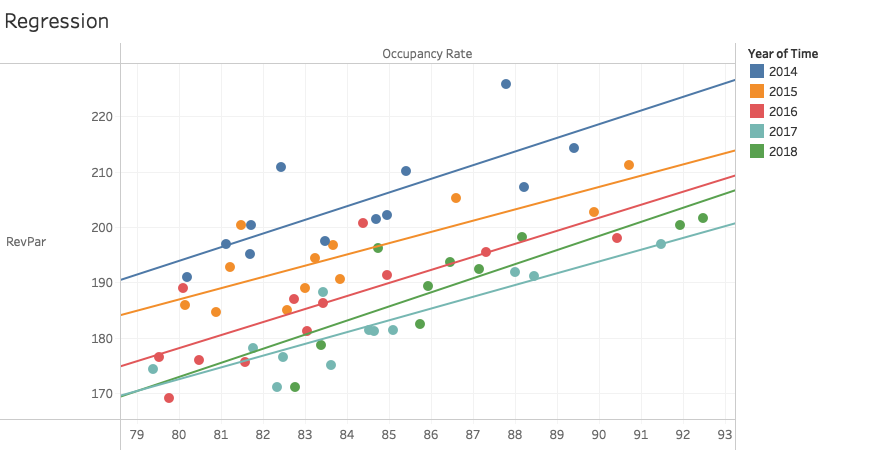
Regression Model
Regression models every year show that there seems to be a correlation between occupancy rate and RevPar. Every year’s model is accompanied with a P-value less than 0.05 and an R-Squared between 58% and 77%
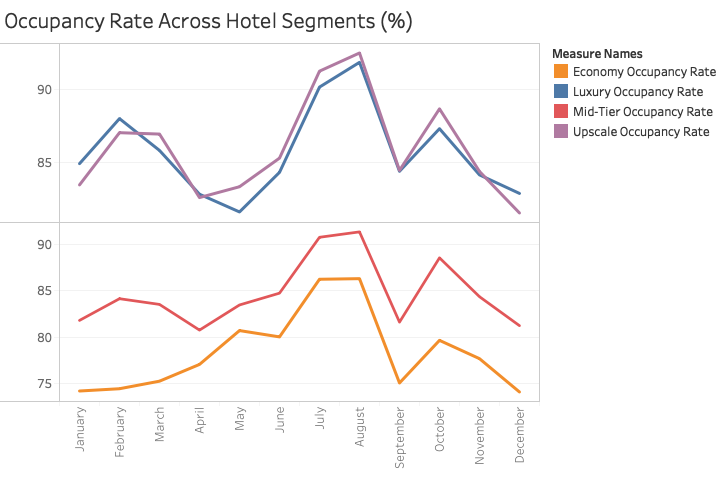
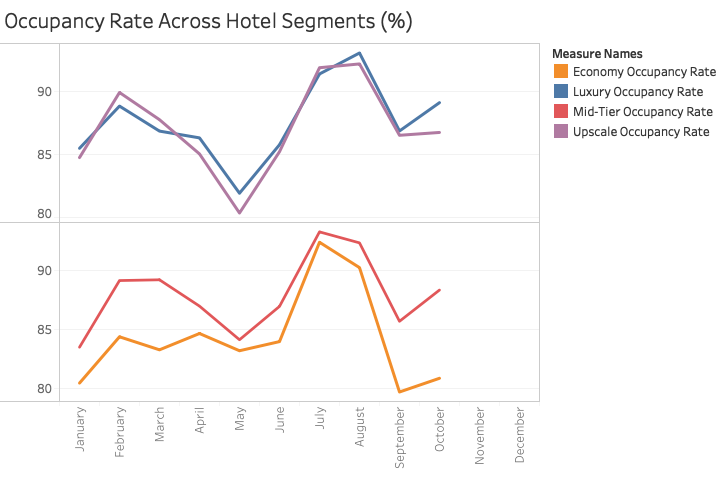
Seasonality
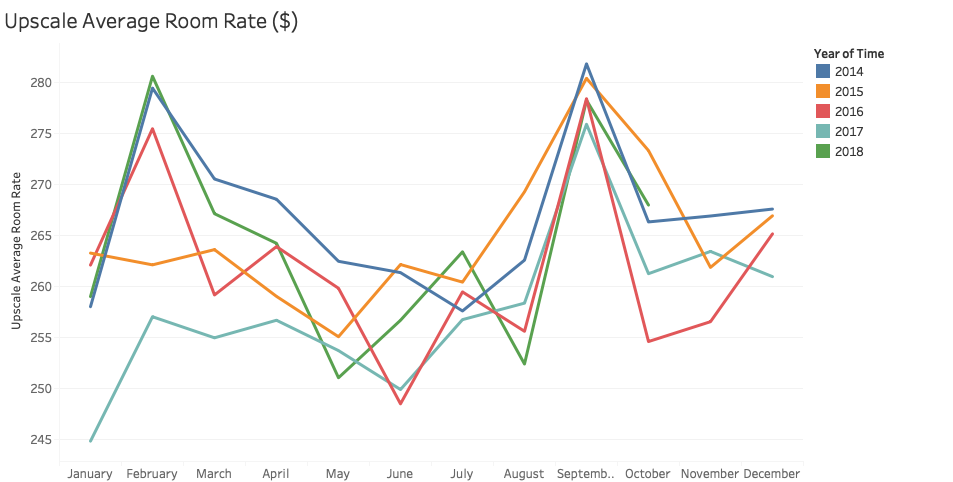
Regarding seasonality of Singapore’s tourism industry, every September seems to take a sharp decline in terms of occupancy rate, compared to the same year’s July and August. It’s an interesting phenomenon given that the Singapore Formula 1 Grand Prix takes place every September. Surprisingly, luxury and upscale segments tend to have fared better than mid-tier and economy segments from 2014 to 2016 and in 2018. My theory is that September may be a traditionally low month for Singapore and as a result, sees a low occupancy rate. However, hotels either push prices alone higher or package room rates with Formula 1 weekend tickets. The average room rate; therefore, may be driven up higher despite a low occupancy rate.
In 2014

In 2015
In 2016

In 2017

In 2018
It’s very interesting since if the demand is not there, businesses don’t usually drive up the prices. As a matter of fact, prices are usually lowered to stimulate the demand. My theory for such a phenomenon is cited above with regards to the Formula 1 Grand Prix in Singapore.
Luxury Segment

Upscale Segment
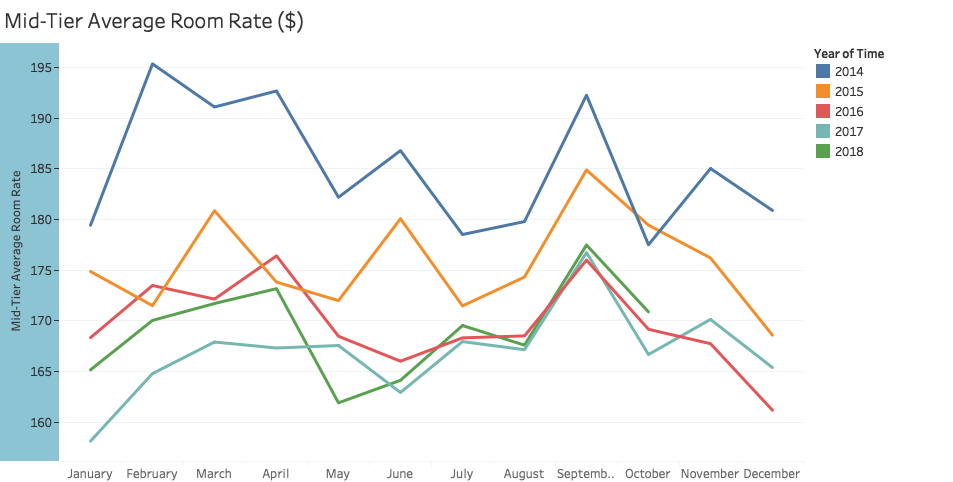
Mid-Tier Segment
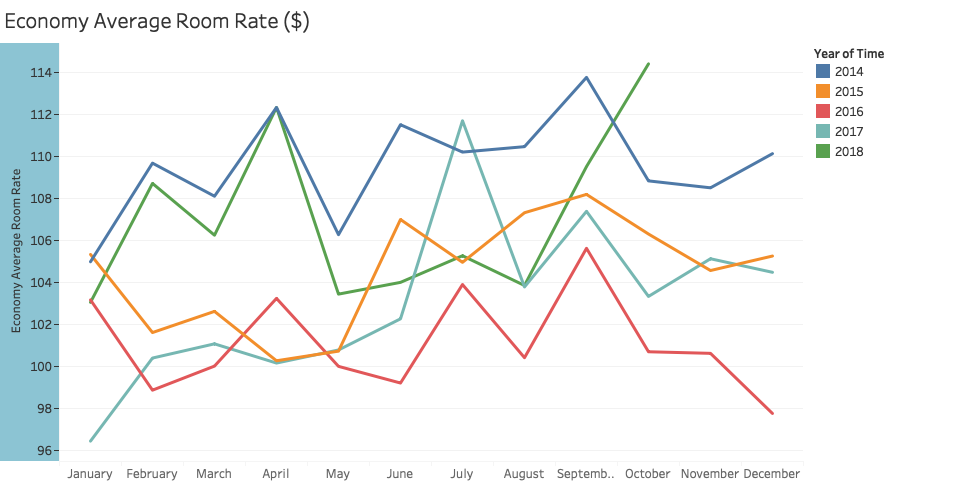
Economy Segment

Leave a comment