Yesterday, Slack filed to go public. In this post, I am laying out what I learned from reading the document
- In the three months ending 31st January, 2019, there are more than 10 million Daily Active Users; 500,000 register developers; 450,000 third-party applications; 50 million collective usage hours; 1 billion messages sent
- There are more than 500,000 organizations on free subscription and 88,000 paid customers, including 65 companies of the Fortune 100. Slack’s competitors include Facebook (Hangouts), Google (Workplace) and Microsoft (Teams). Even though Microsoft announced that there are 500,000 organizations using the service, including 91 of the Fortune 100, it’s tricky to form an apple-to-apple comparison. Teams can be used either free-of-charge or part of a paid Office 365 plan. There is no detail yet on what makes up the 500,000 figure.
- Annual revenue was recorded at $105.2 million, $220.5 million, and $400.6 million in fiscal years 2017, 2018, and 2019 respectively
- Out of the total revenue, international revenue represents 34%, 34% and 36% in 2017, 2018 and 2019 respectively
- In fiscal years 2017, 2018, and 2019, approximately 22%, 32%, and 40%, respectively, of the annual revenue was generated from Paid Customers >$100,000.
- In the fiscal year ended 31st January, 2019, 8% of the annual revenue came from customers who used the free plan prior, down from 10% a year before
- “More than 90% of Paid Customers used a third-party application or custom integration in the week ended January 31, 2019”
Impressive Growth of Paid Customers >$100,000

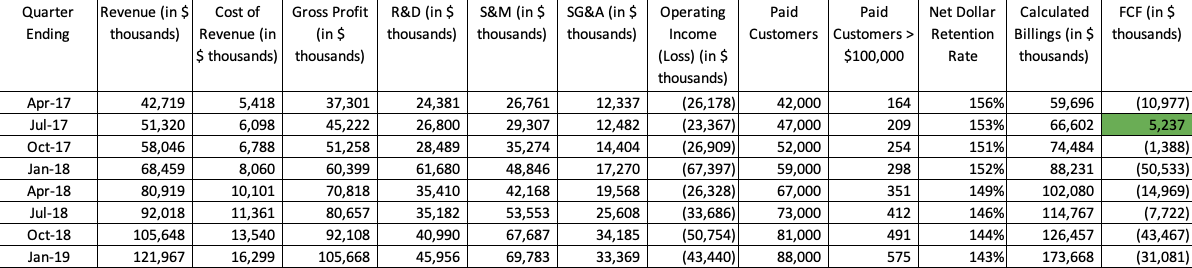
The CAGR of Paid Customers whose ARR is bigger than $100,000 is impressive. So is the CAGR of the revenue, gross profit and calculated billings. Though Slack hasn’t made money from its operations, the loss has contracted through the quarters at the rate of 7.50%. Net Dollar Retention Rate has slowed down.
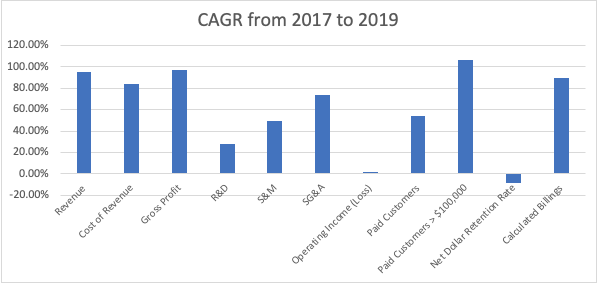
When looked at from an annual basis, the growth of the Paid Customer > $100,000 is even more impressive.
| Year | Revenue | Cost of Revenue | Gross Profit | R&D | S&M | SG&A | Operating Income (Loss) |
| 2017 | 100% | 14% | 86% | 92% | 99% | 36% | -141% |
| 2018 | 100% | 12% | 88% | 64% | 64% | 26% | -65% |
| 2019 | 100% | 13% | 87% | 39% | 58% | 28% | -38% |
From the Annual CAGR chart, the scale of economies seems a bit clearer as expenses don’t grow at the same clip as revenue and gross profit. In terms of breakdown of revenue, Operating Loss as % of Revenue has been decreasing quite rapidly, along with R&D and Sales & Marketing. For the last two years, most of the improvement in Operating Loss came from R&D spending as % of Revenue. There is not much more that can be said about it definitely. Perhaps, Slack feels that there is enough investment and sufficient talent in R&D, meaning that it is not necessary to waste valuable dollars.

Reliance on AWS and Ramifications
For instance, Slack currently only utilizes AWS data centers located in the United States but certain organizations, or categories of organizations, may limit their adoption or use of Slack unless we also utilize local AWS data centers, such as data centers in Europe, Asia, and Latin America.
For example, Russia and China are among a number of countries that have recently blocked certain online services, including AWS, which hosts Slack, making it very difficult for such services to access those markets.
From 2018 to 2023, Slack commits to spend $50 million each year on AWS
It’s going to be a direct listing
It means a less expensive process for Slack. The current stockholders are not under a contractual lock-up agreement. If enough stocks are sold when or shortly after Slack goes public, it may cause the price to contract.
They have negative free cash flow in all, but one quarter

Leave a comment