Interested in how enterprise SaaS companies whose some or all of their revenue come from subscriptions, I set out to collect data from the companies that I know offer subscriptions to enterprise customers. Please be aware that this is my personal research stemming from intellectual curiosity only. They are not meant to be anything more than that.
- Data is collected from the latest year in the companies’ latest annual reports to ensure that seasonality factor is removed
- The metrics include subscription gross margin (subscription gross profit/subscription revenue), overall gross margin, Sales & Marketing expense as % of revenue, R&D as % of revenue, SG&A as % of revenue and net dollar expansion rate (or retention rate)
- If there is a difference between subscription gross margin and overall gross margin, it’s because those companies also generate revenue from other sources such as hardware or professional services
- Much as I tried to keep the figures accurate, do use them at your discretion
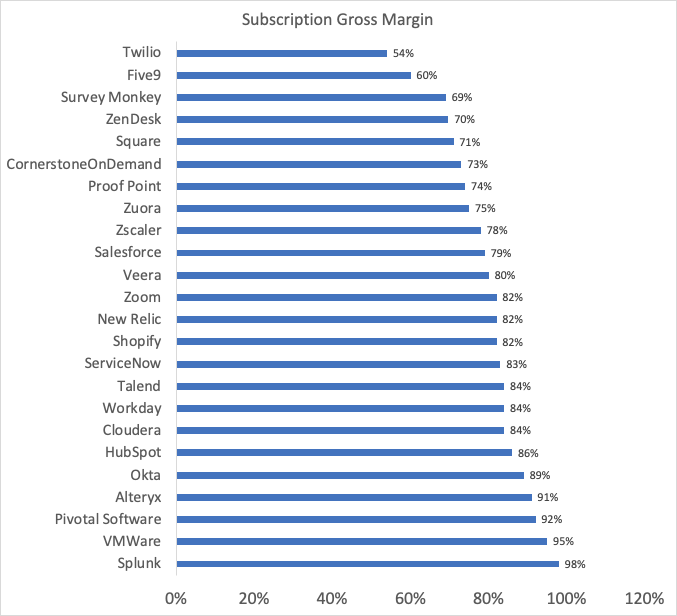
Subscription Gross Margin
Median: 82%/ Mean: 80%
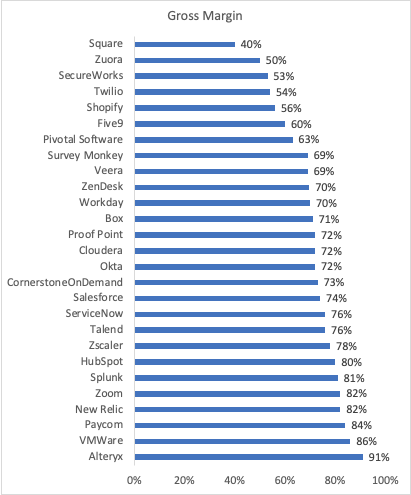
Gross Margin
Median: 72%/ Mean: 71%
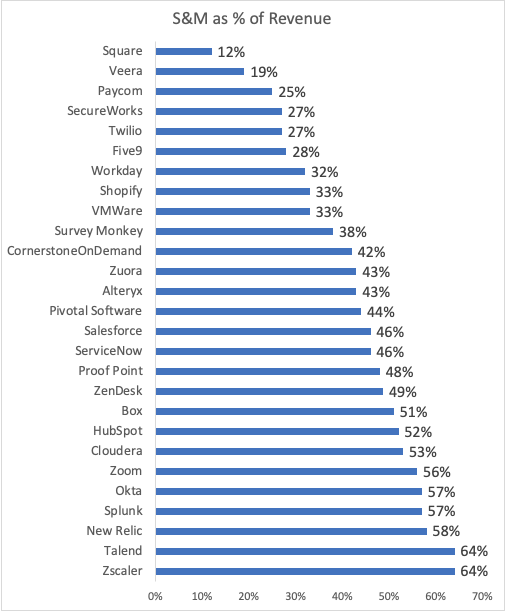
Sales & Marketing Expense as % of Revenue
Median: 44%/ Mean: 42%
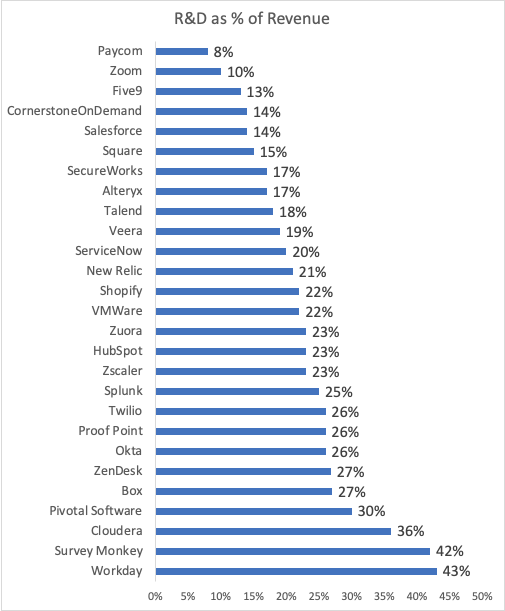
R&D as % of Revenue
Median: 22% / Mean: 22%
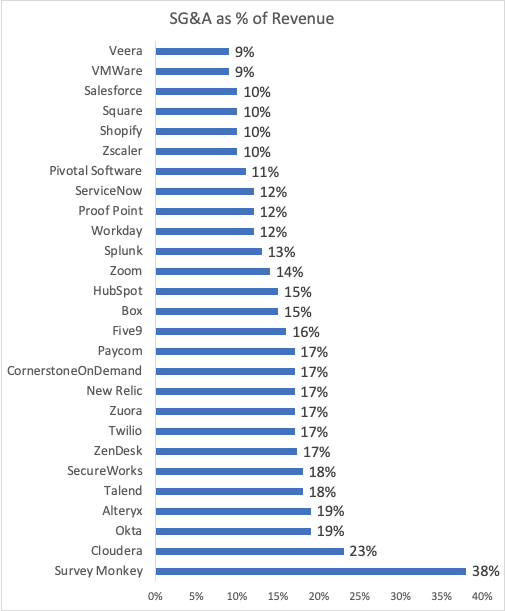
SG&A as % of Revenue
Median: 15% / Mean: 15%
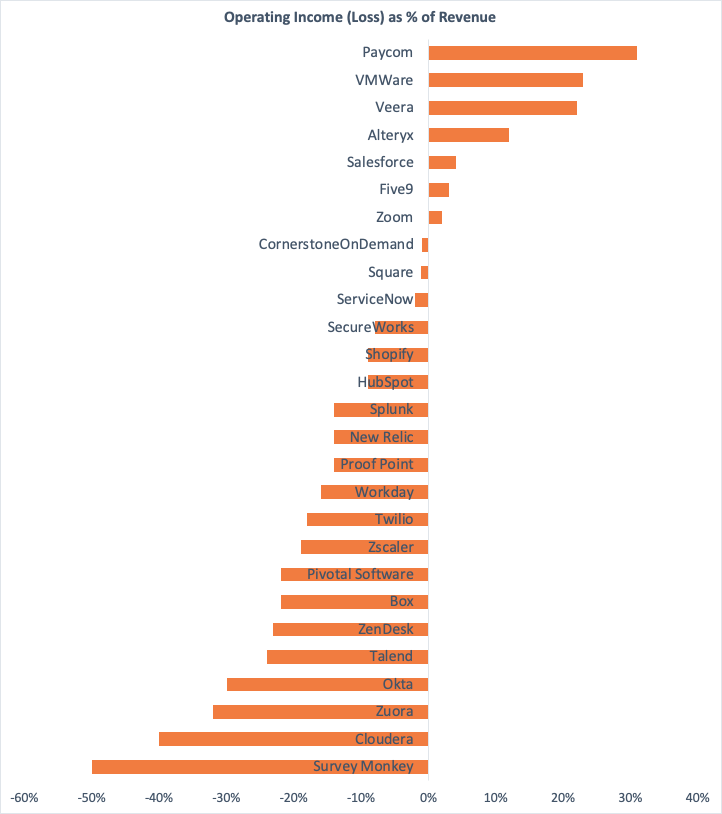
Operating Income (Loss) as % of Revenue
Median: -14%/ Mean: -10%
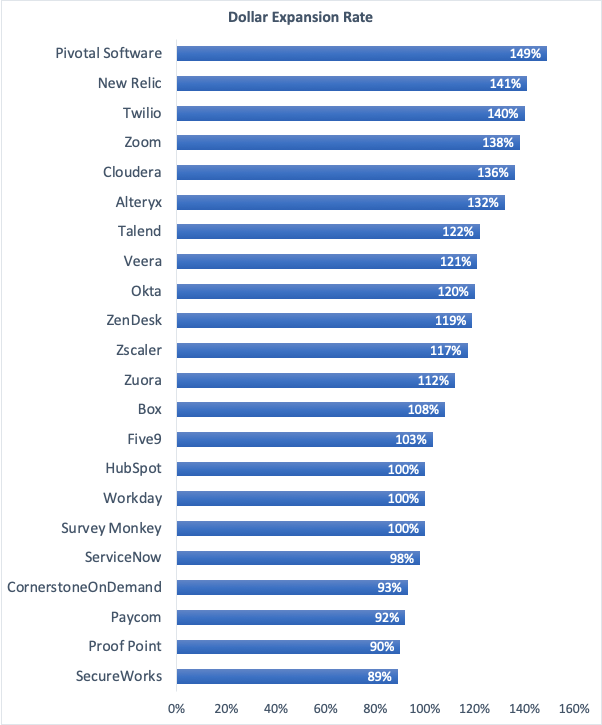
Dollar Expansion Rate
Median: 115% / Mean: 115%

Leave a comment