Amazon’s revenue growth slowed down significantly in the last 6 months after being pulled forward by Covid-19; which may explain the timid growth of their stock price

AWS is now a $56 billion annual run-rate business. This run-rate is actually based on real figures
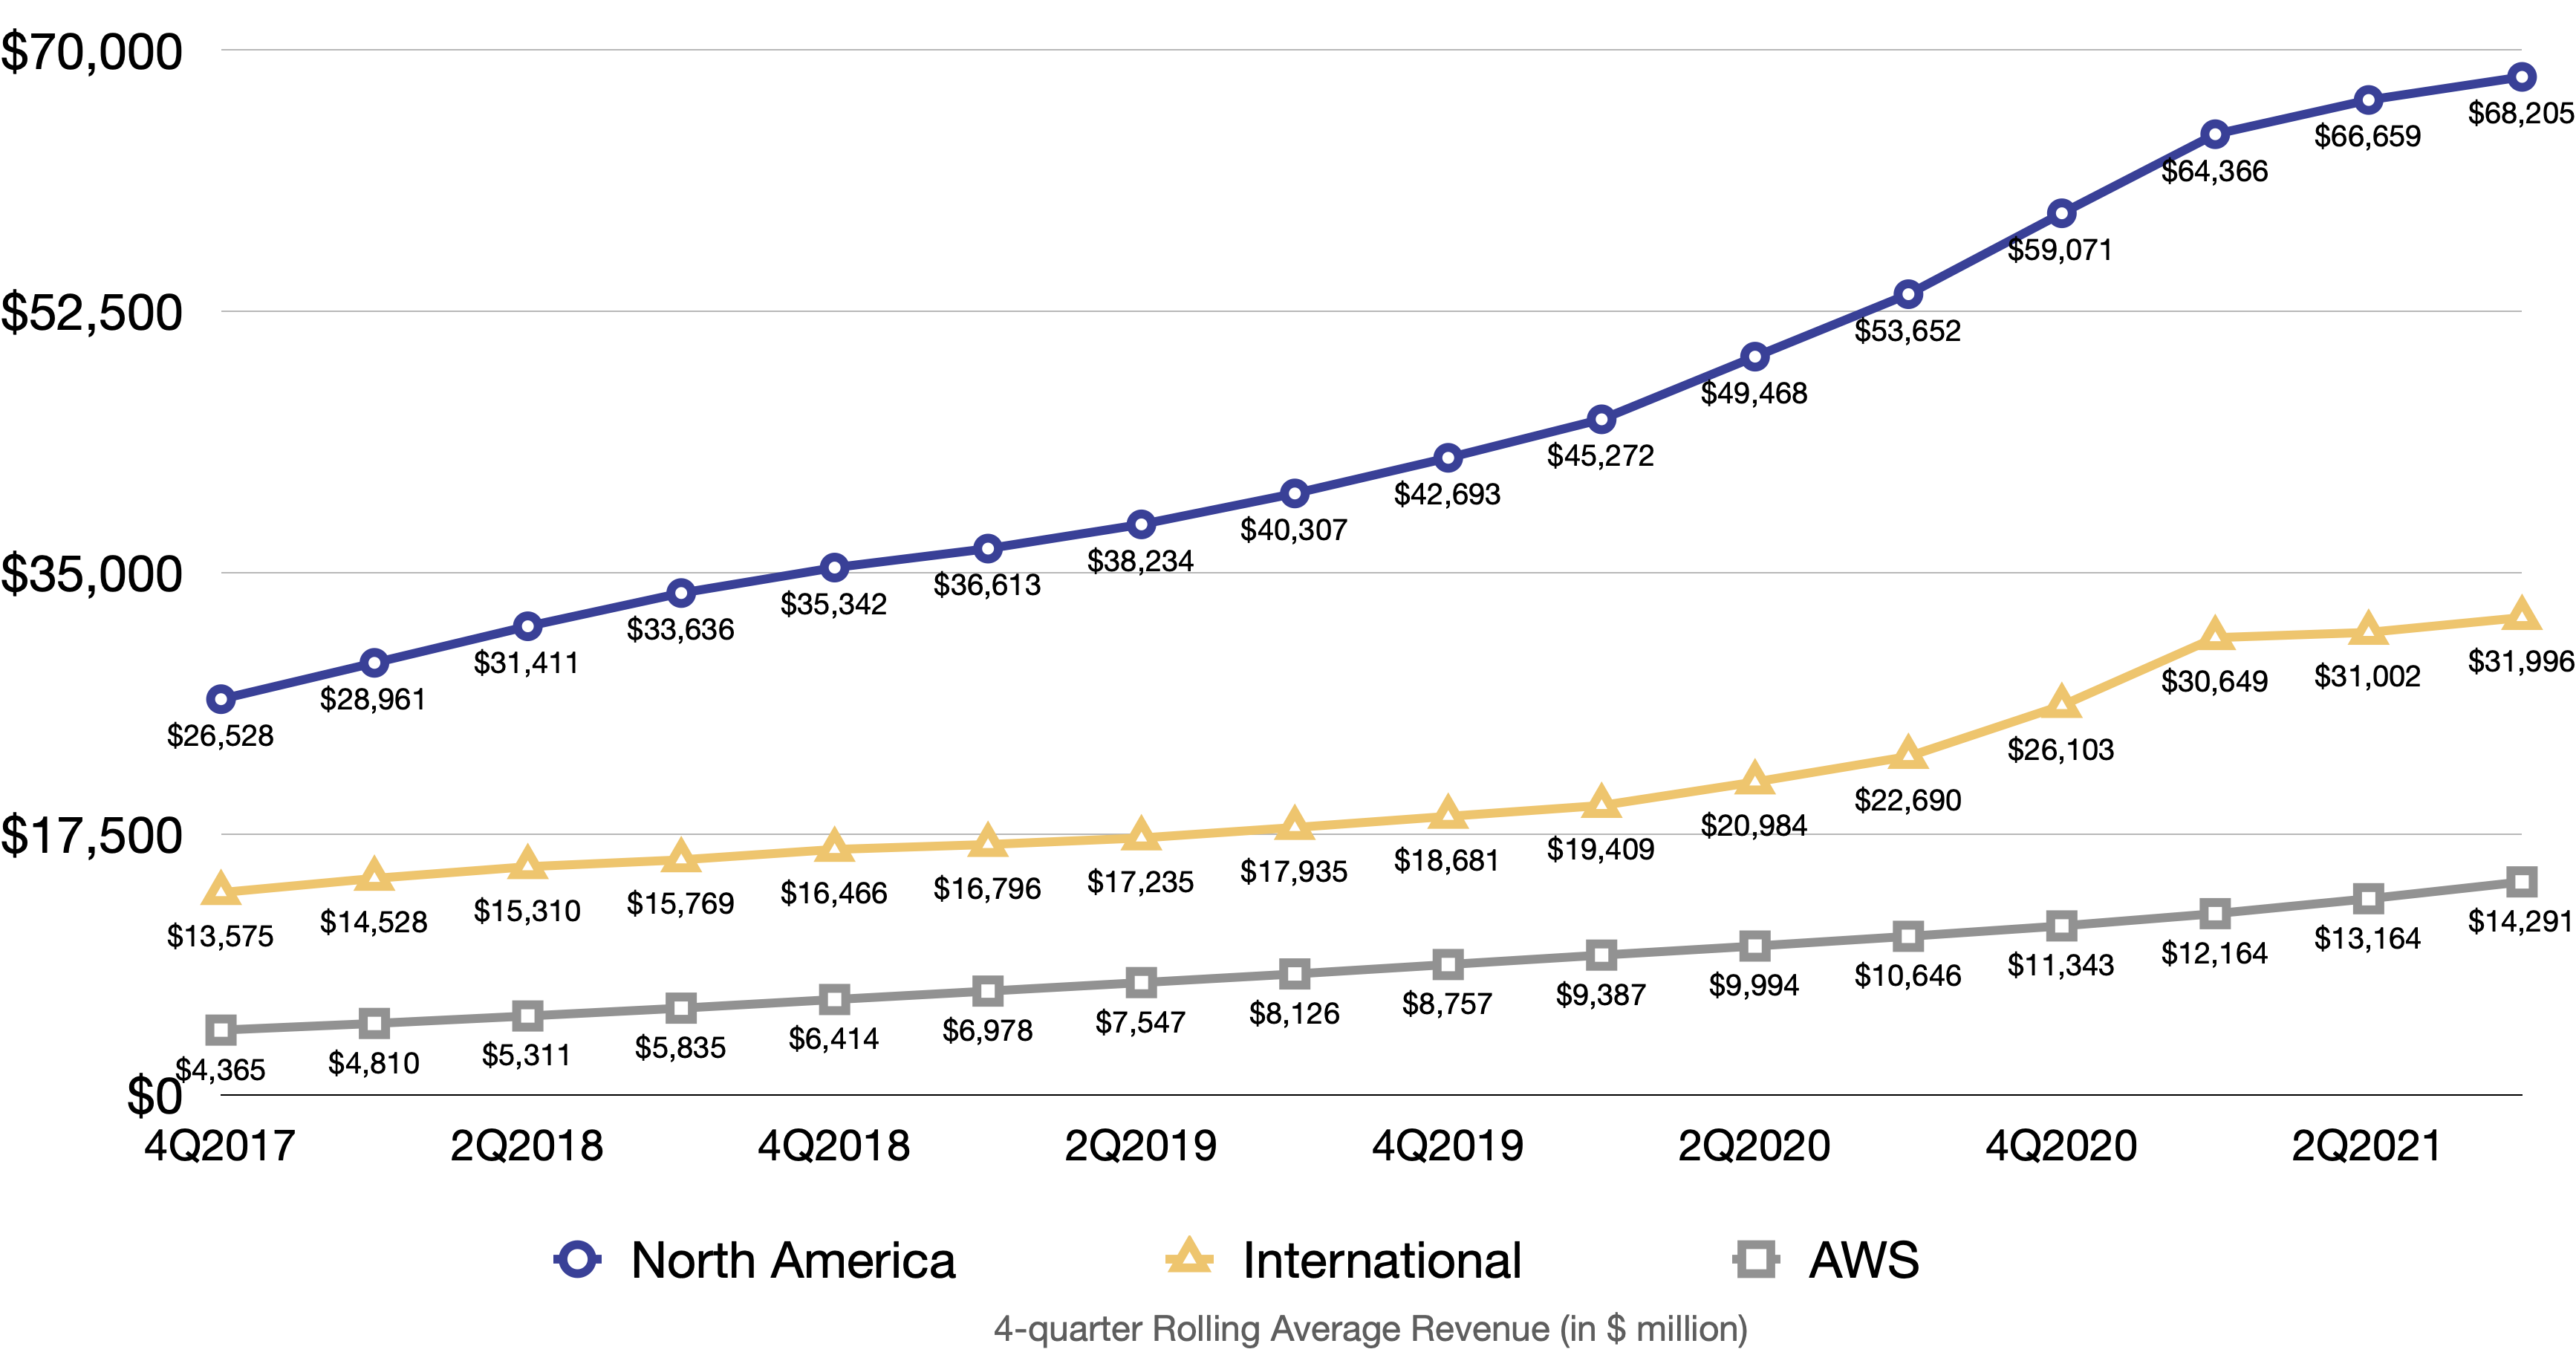
AWS continues to be the margin machine for Amazon. International went back to the red after 5 quarters in the black

Advertising is Amazon’s 4th biggest revenue stream
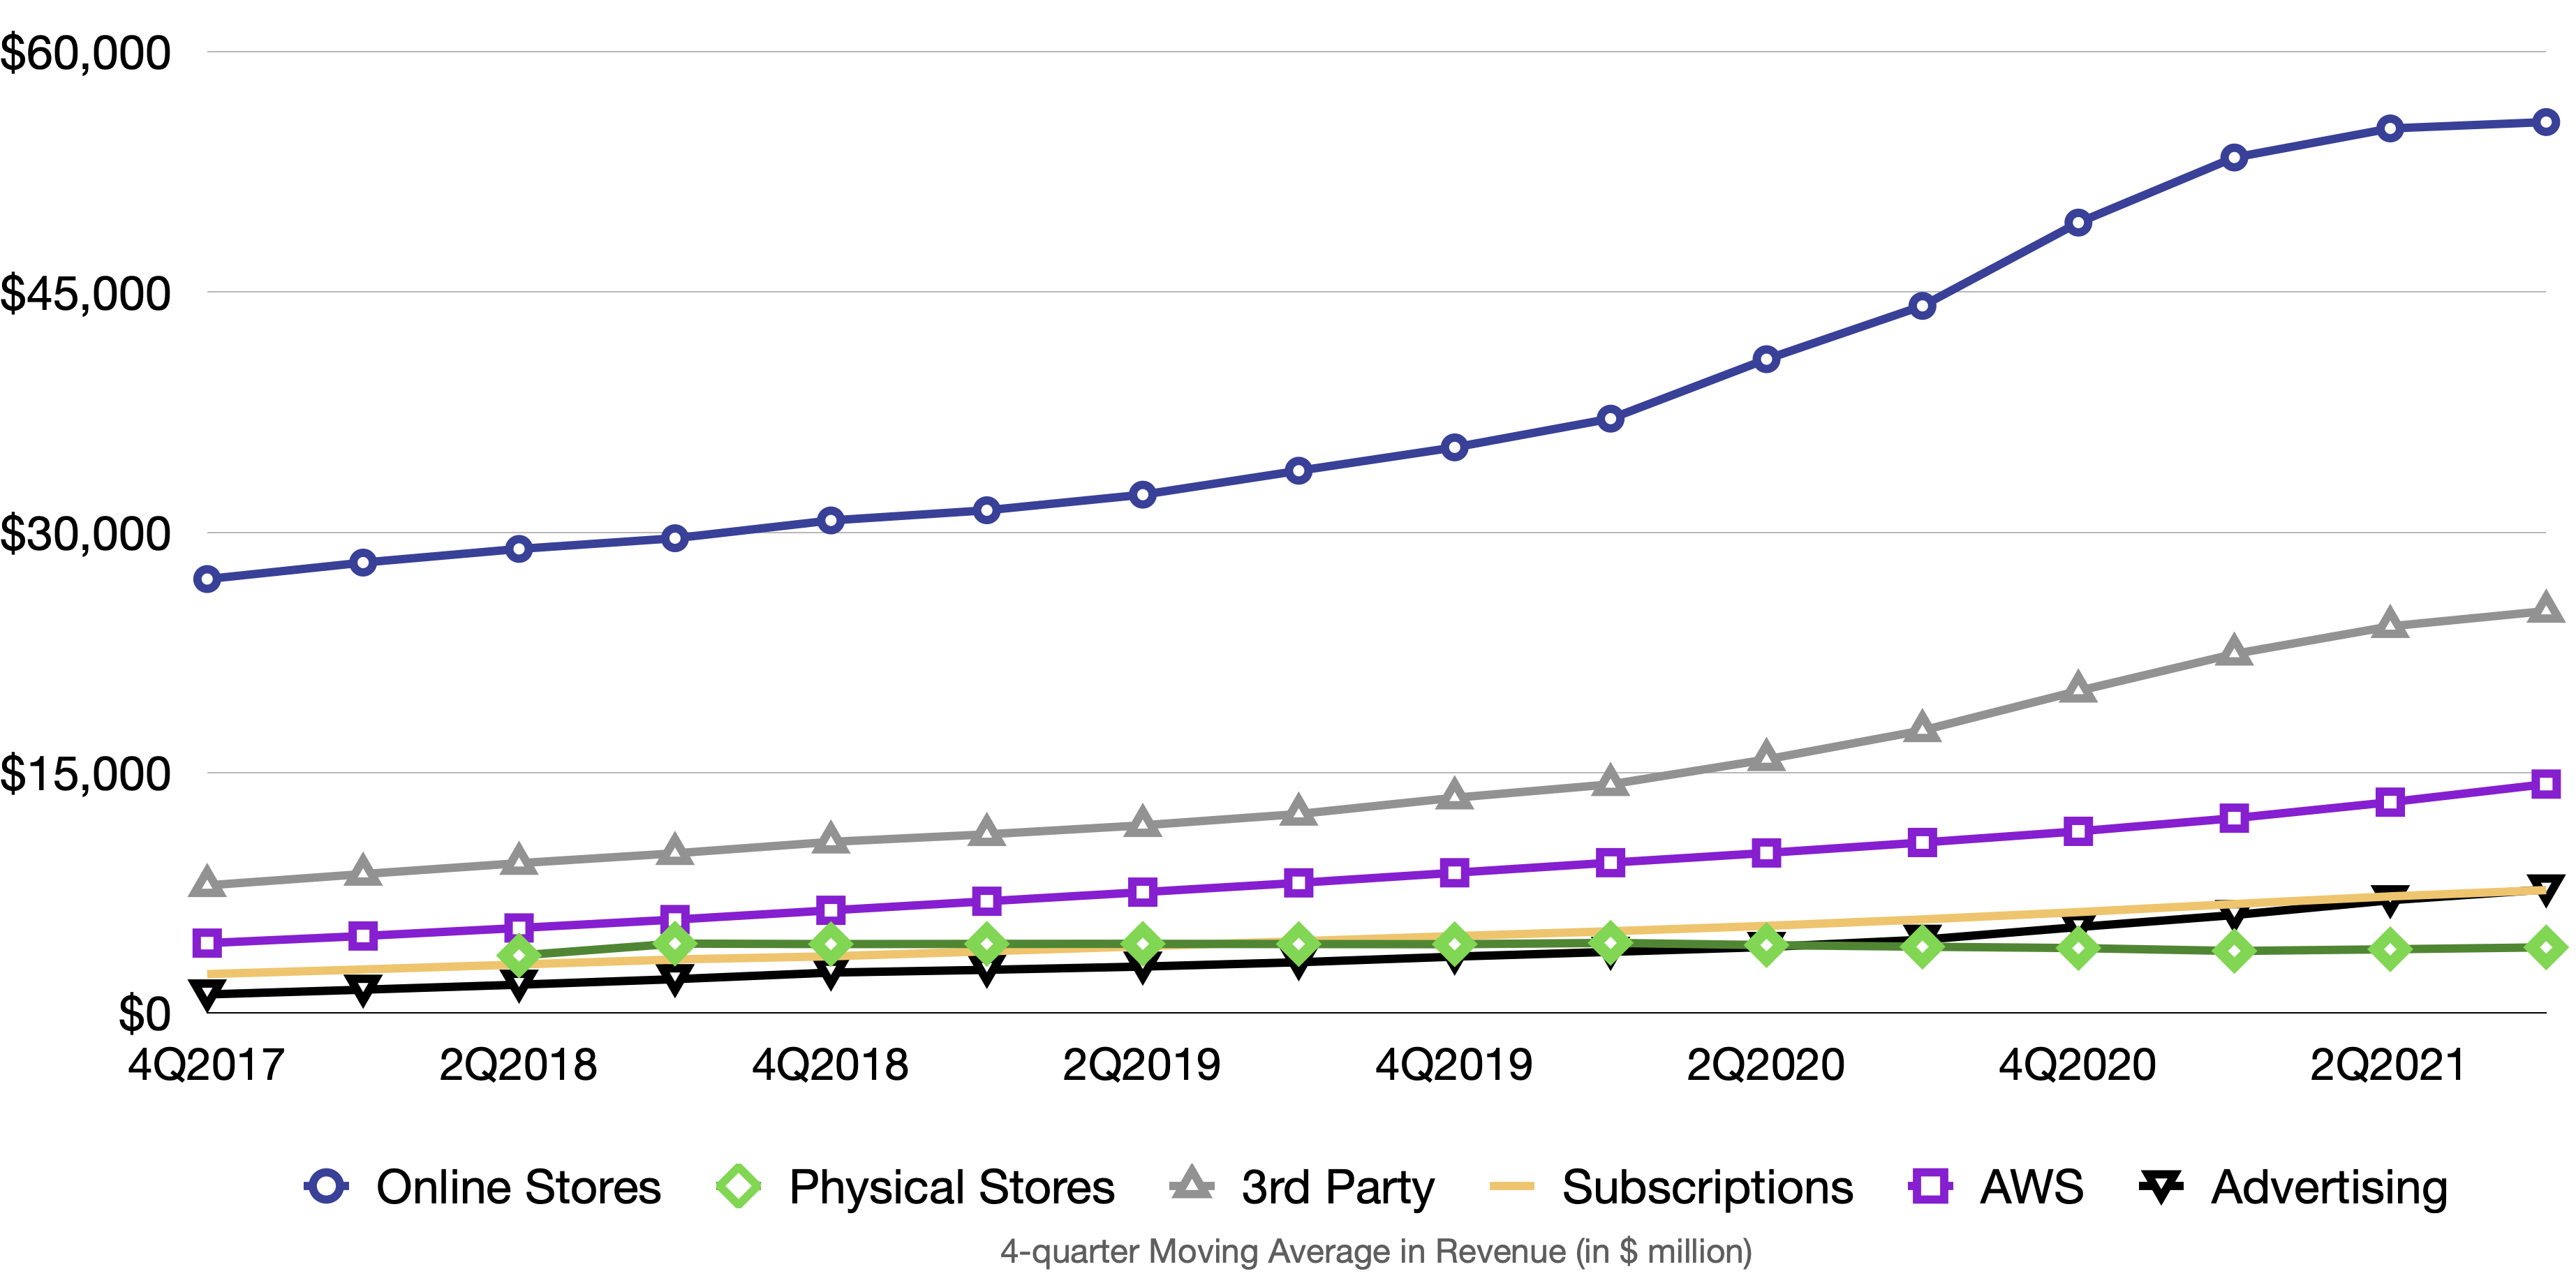
Advertising, AWS and Subscriptions are the top 3 growing segments of the company

Amazon has been investing heavily in the last 6 months, hurting their Free Cash Flow

Shipping costs as % of Online Stores & 3rd-party Marketplace have been increasing. The shipping cost can make it difficult for competition to catch up


Leave a comment