Amazon is the last of the big techs to report earnings. You can find its press release here. I’ll show my notes through the charts below. In short, AWS, advertising and Prime’s price hike are the only bright spots while the rest could be best characterized as concerning, if not downright disappointing. Of course, Amazon is famously playing the long game, but as FCF is significantly down while ex-AWS revenue is tremendously down, management needs to send some positive signals soon.
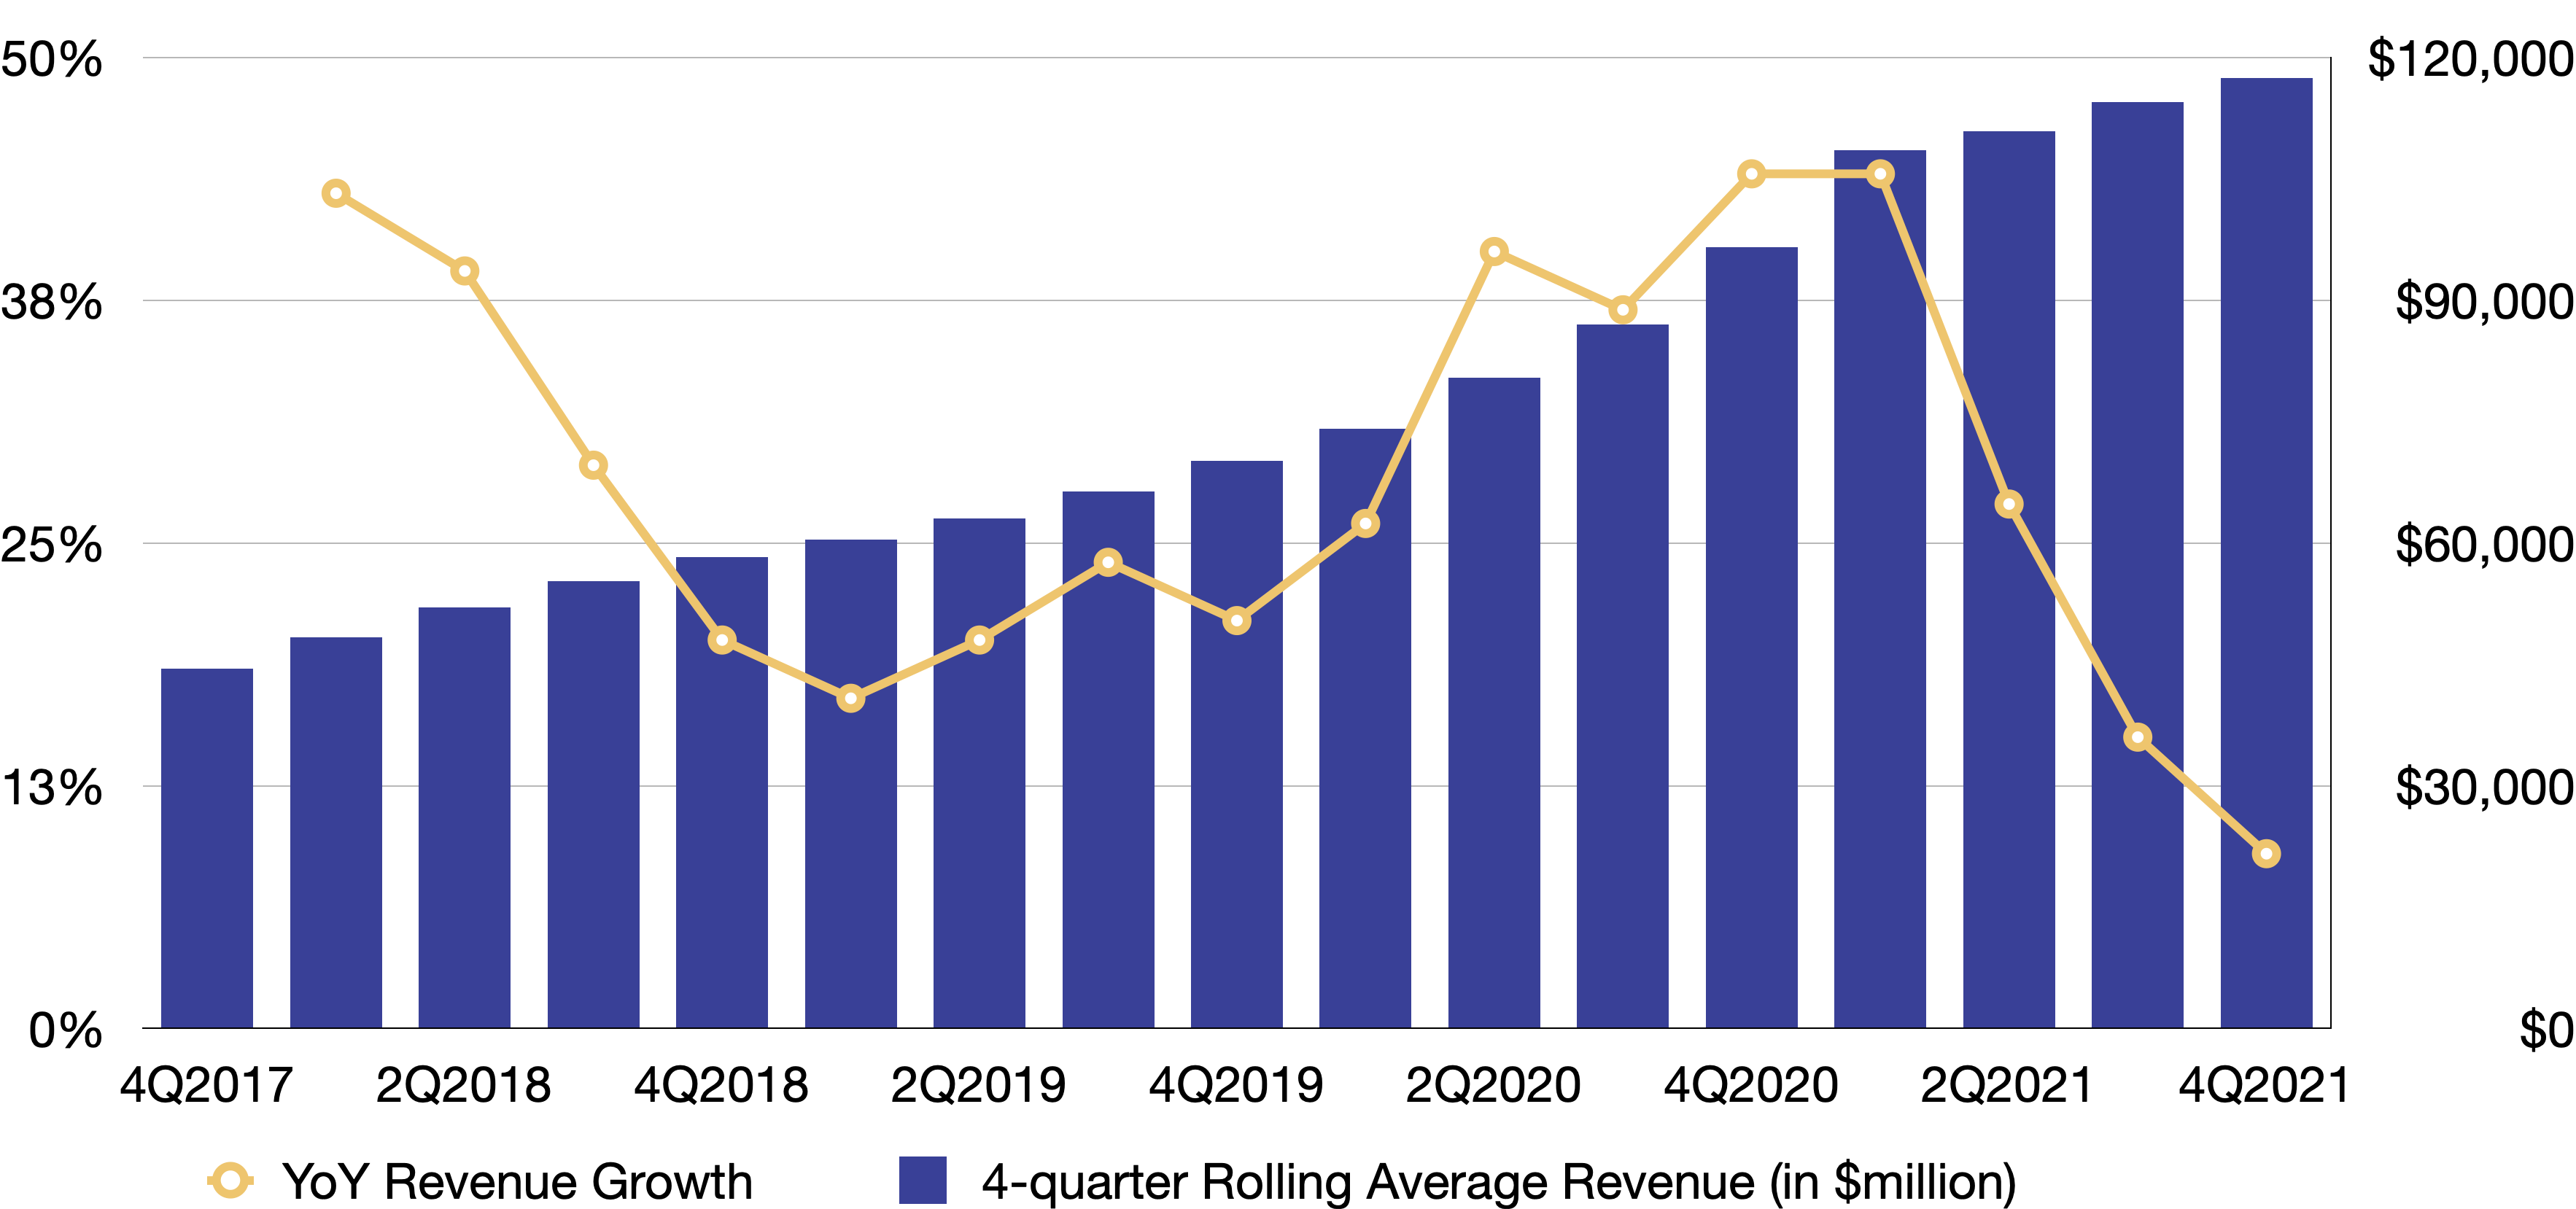
Revenue’s growth decelerated significantly after being boosted by Covid
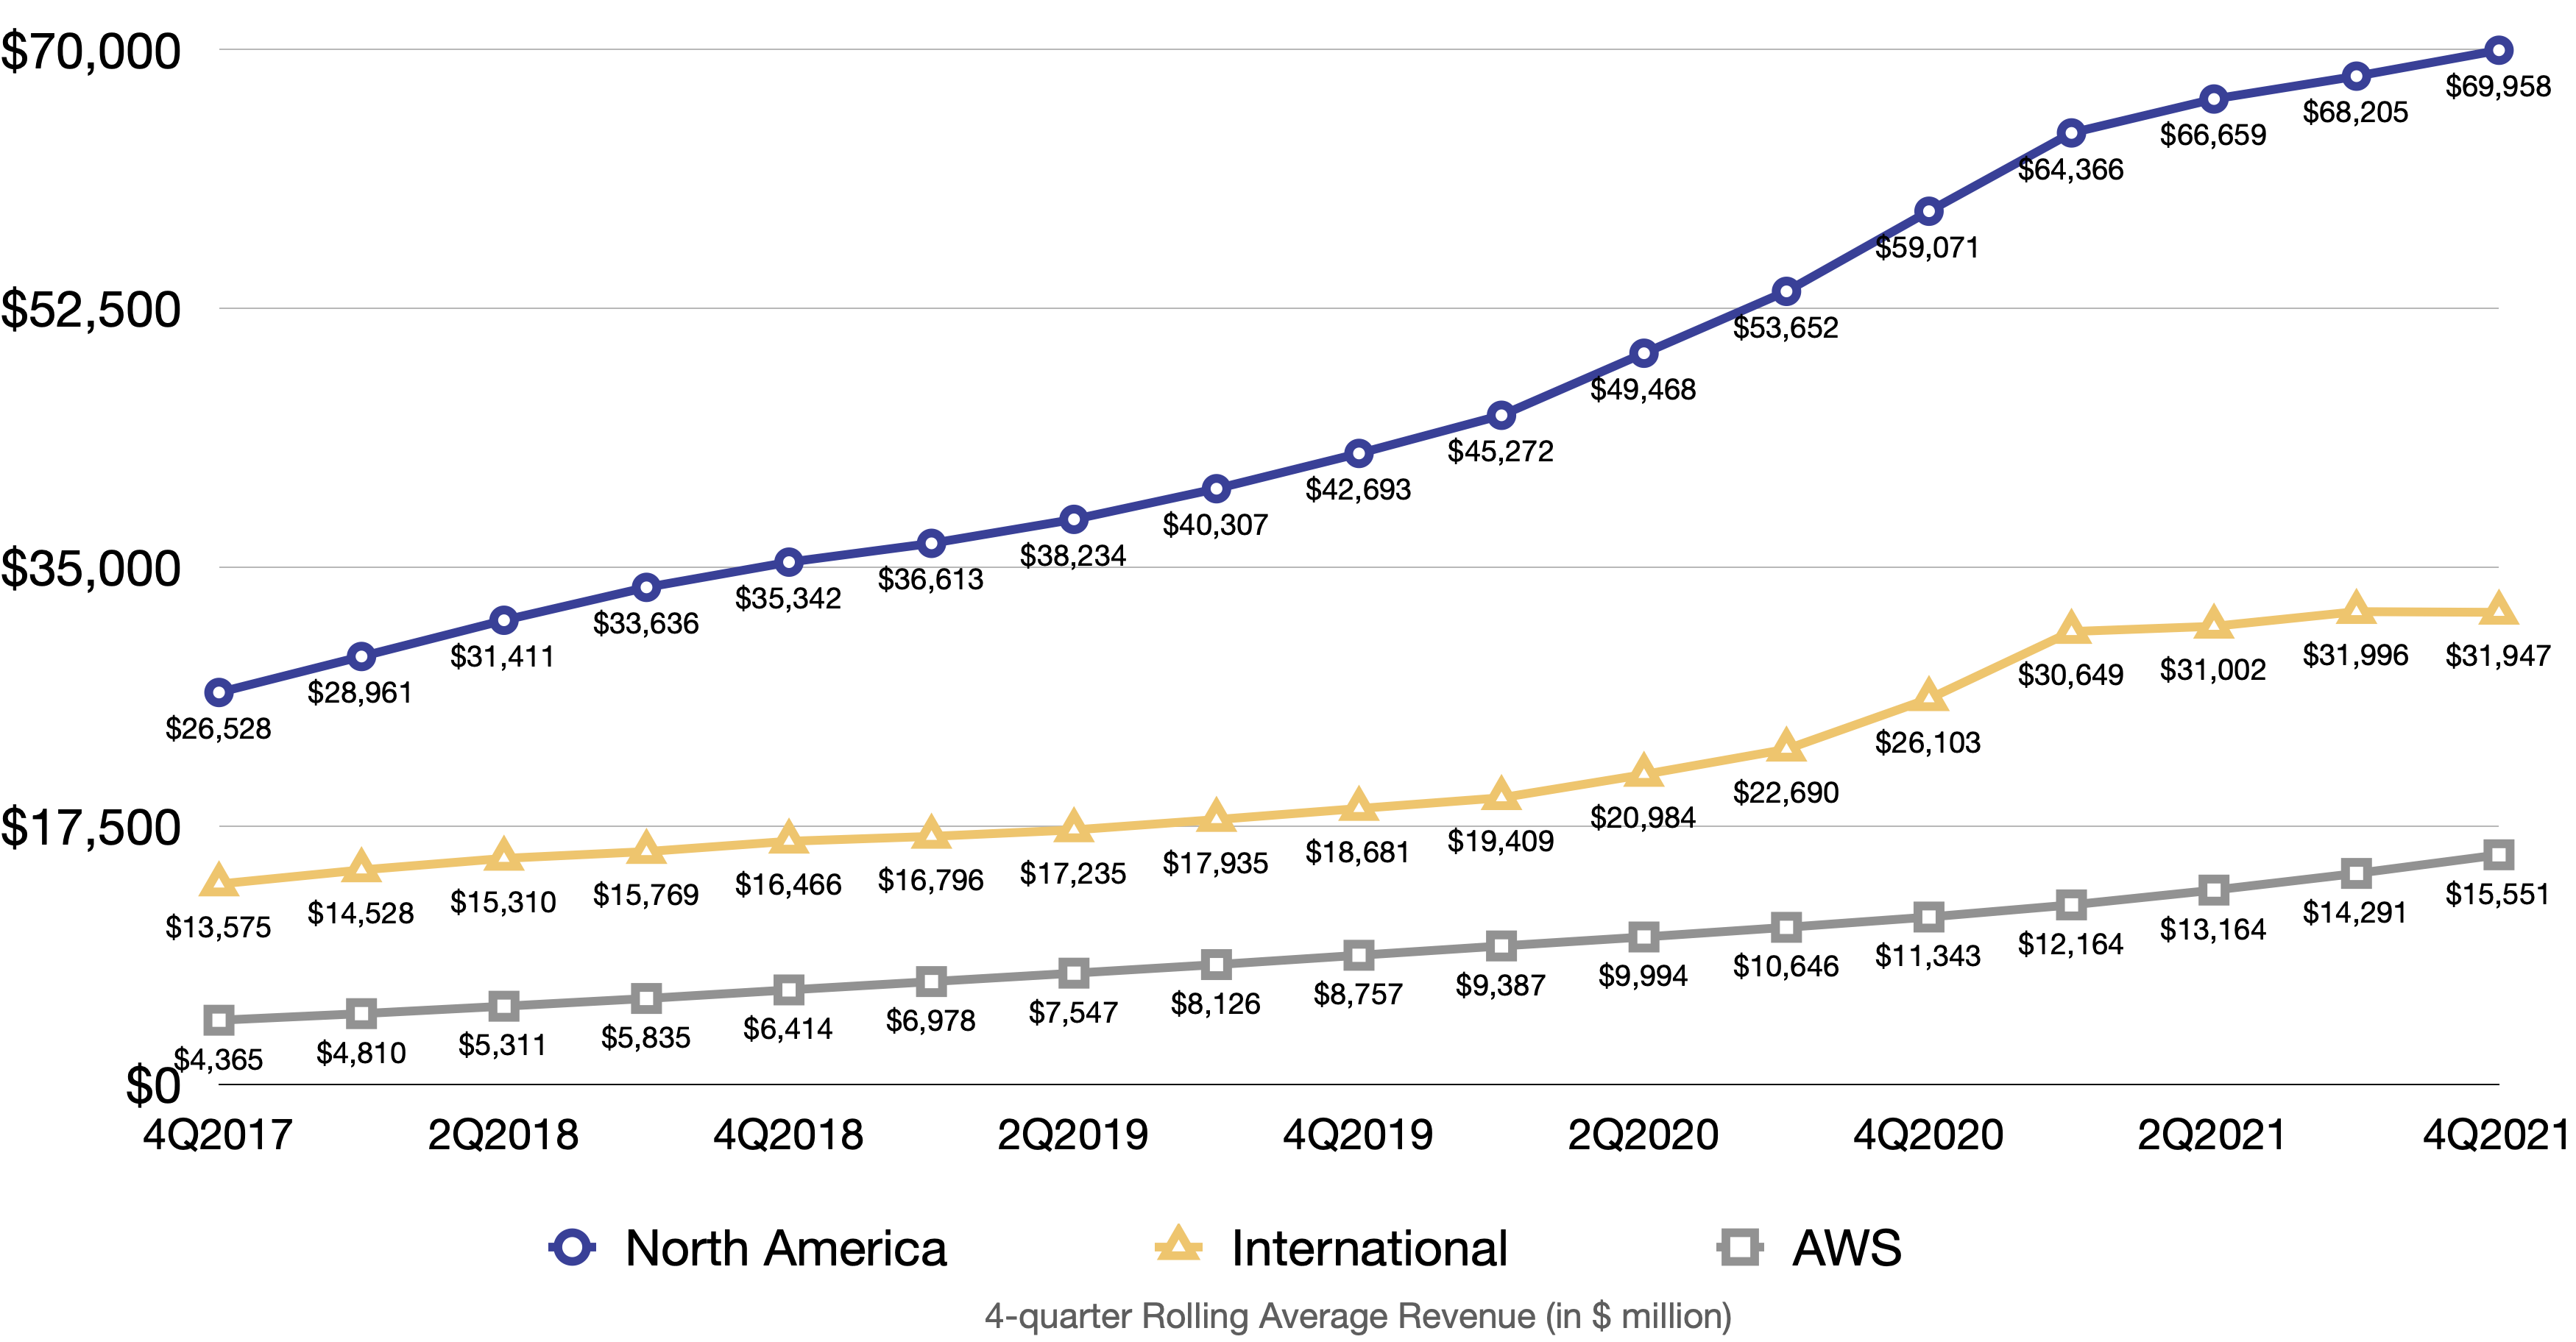
International sales dipped for the first time while AWS continues its hot streak, recording more than $62 billion in revenue in 2021
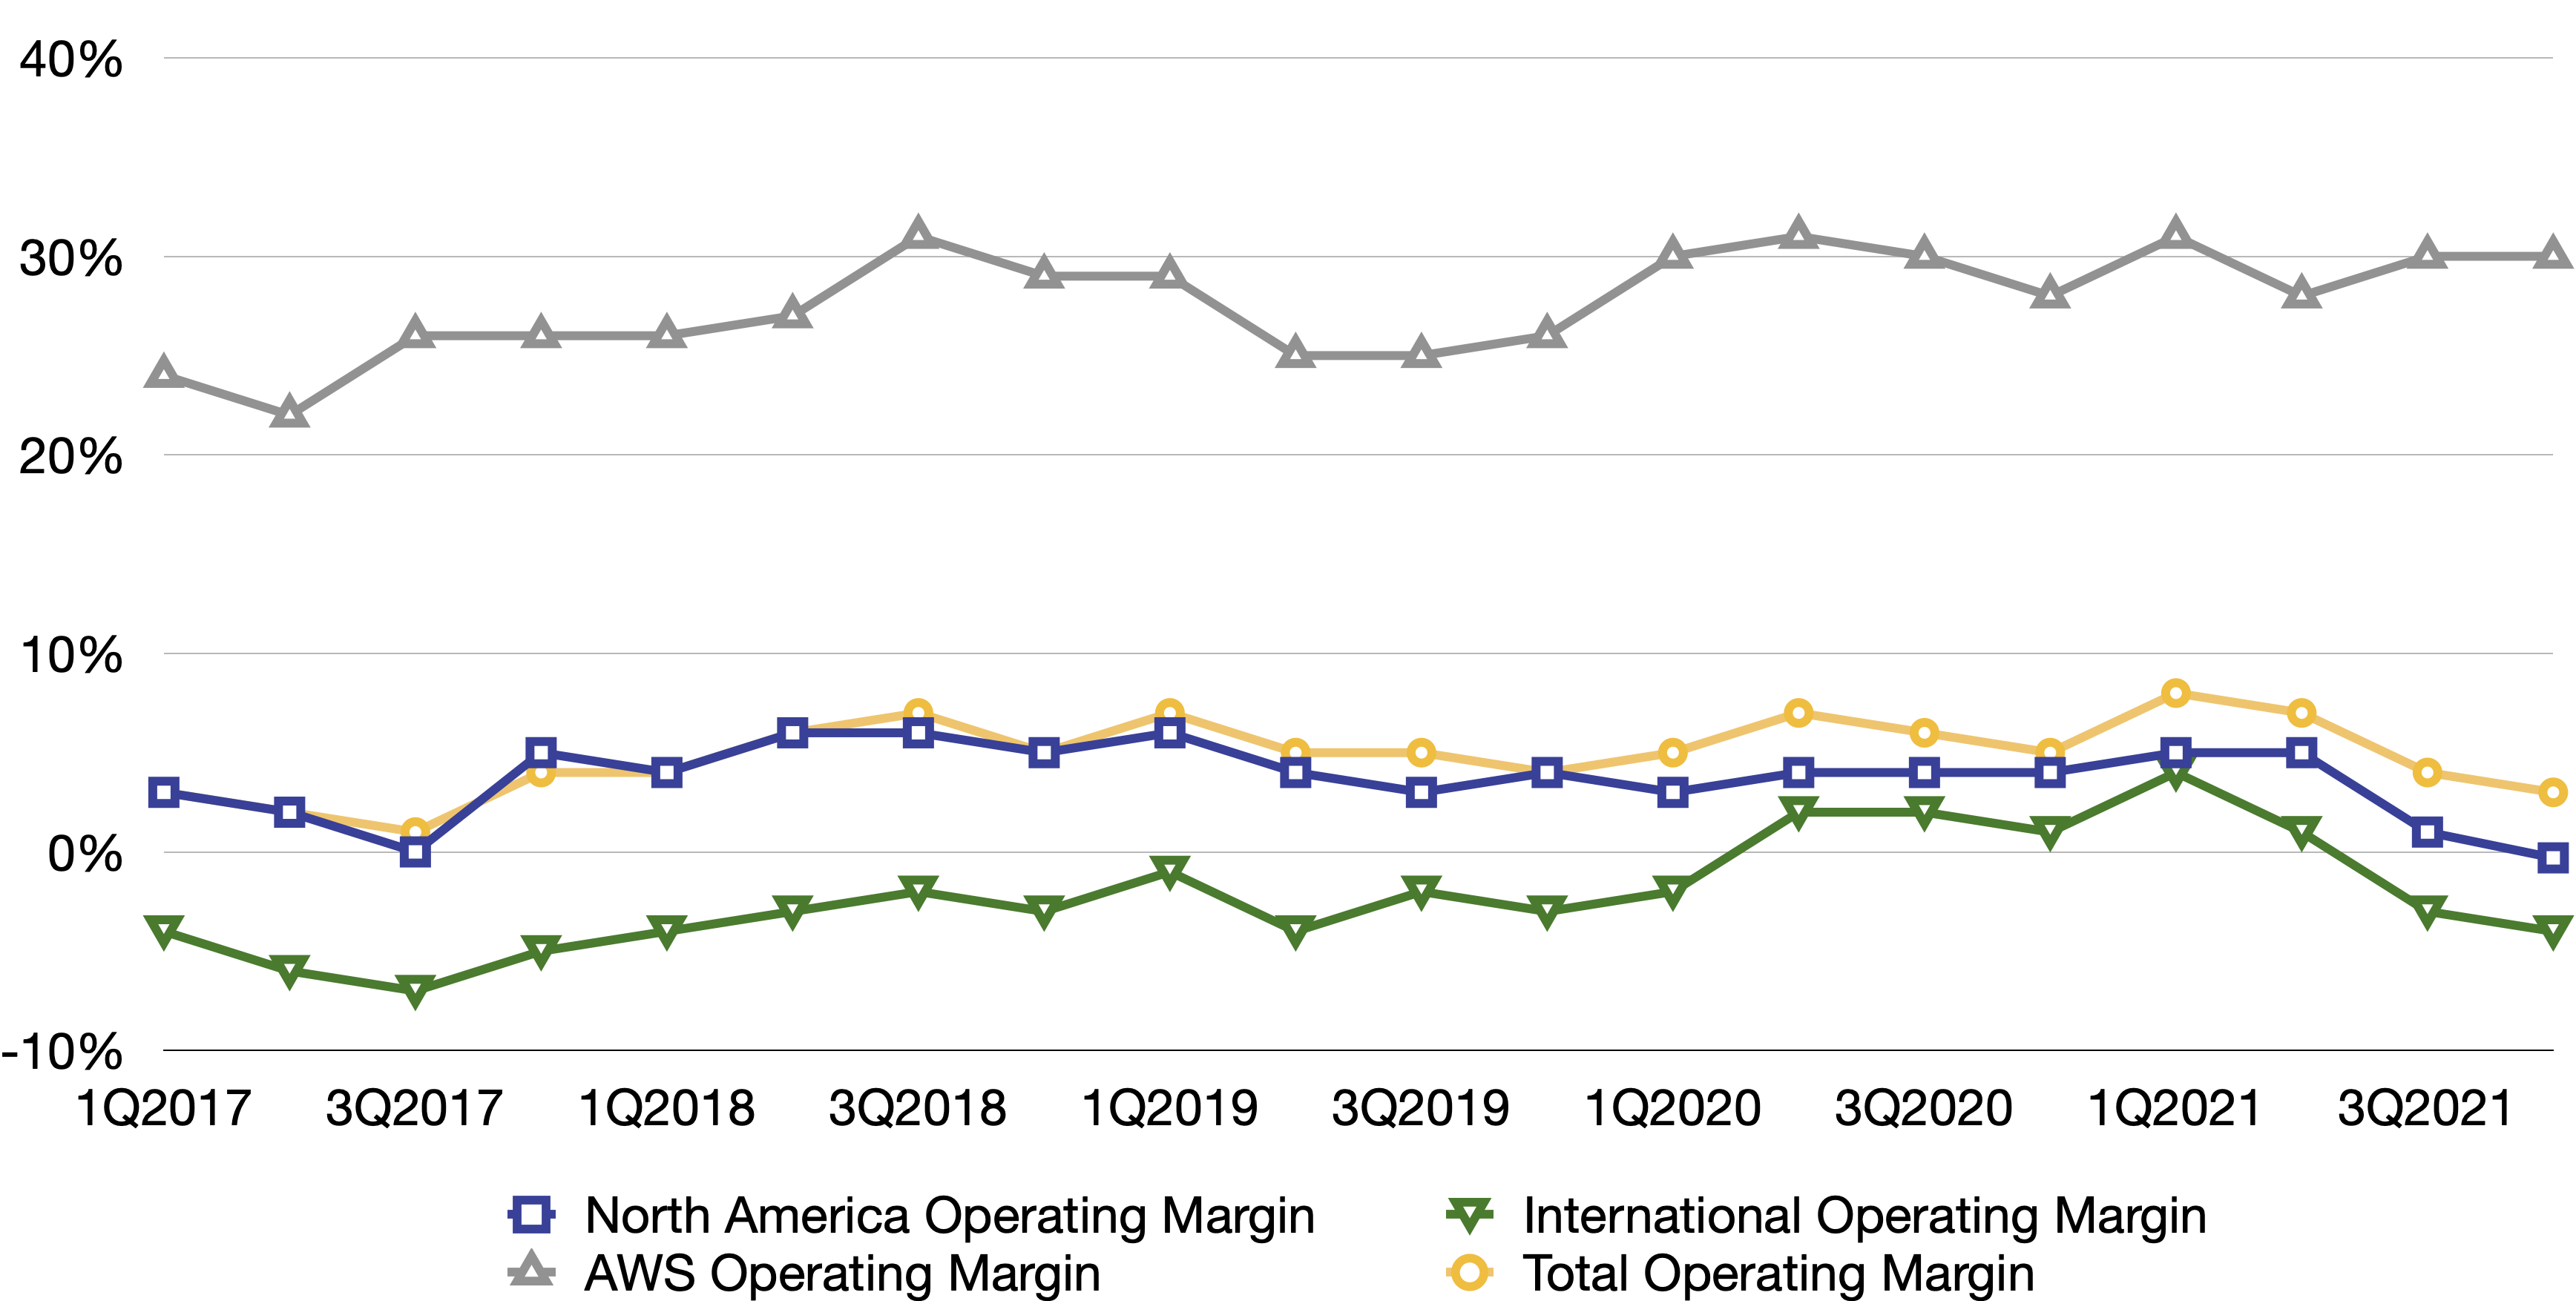
Both North America and International were in the red in Q4 FY2021. AWS is the sole reason why Amazon has a positive operating margin
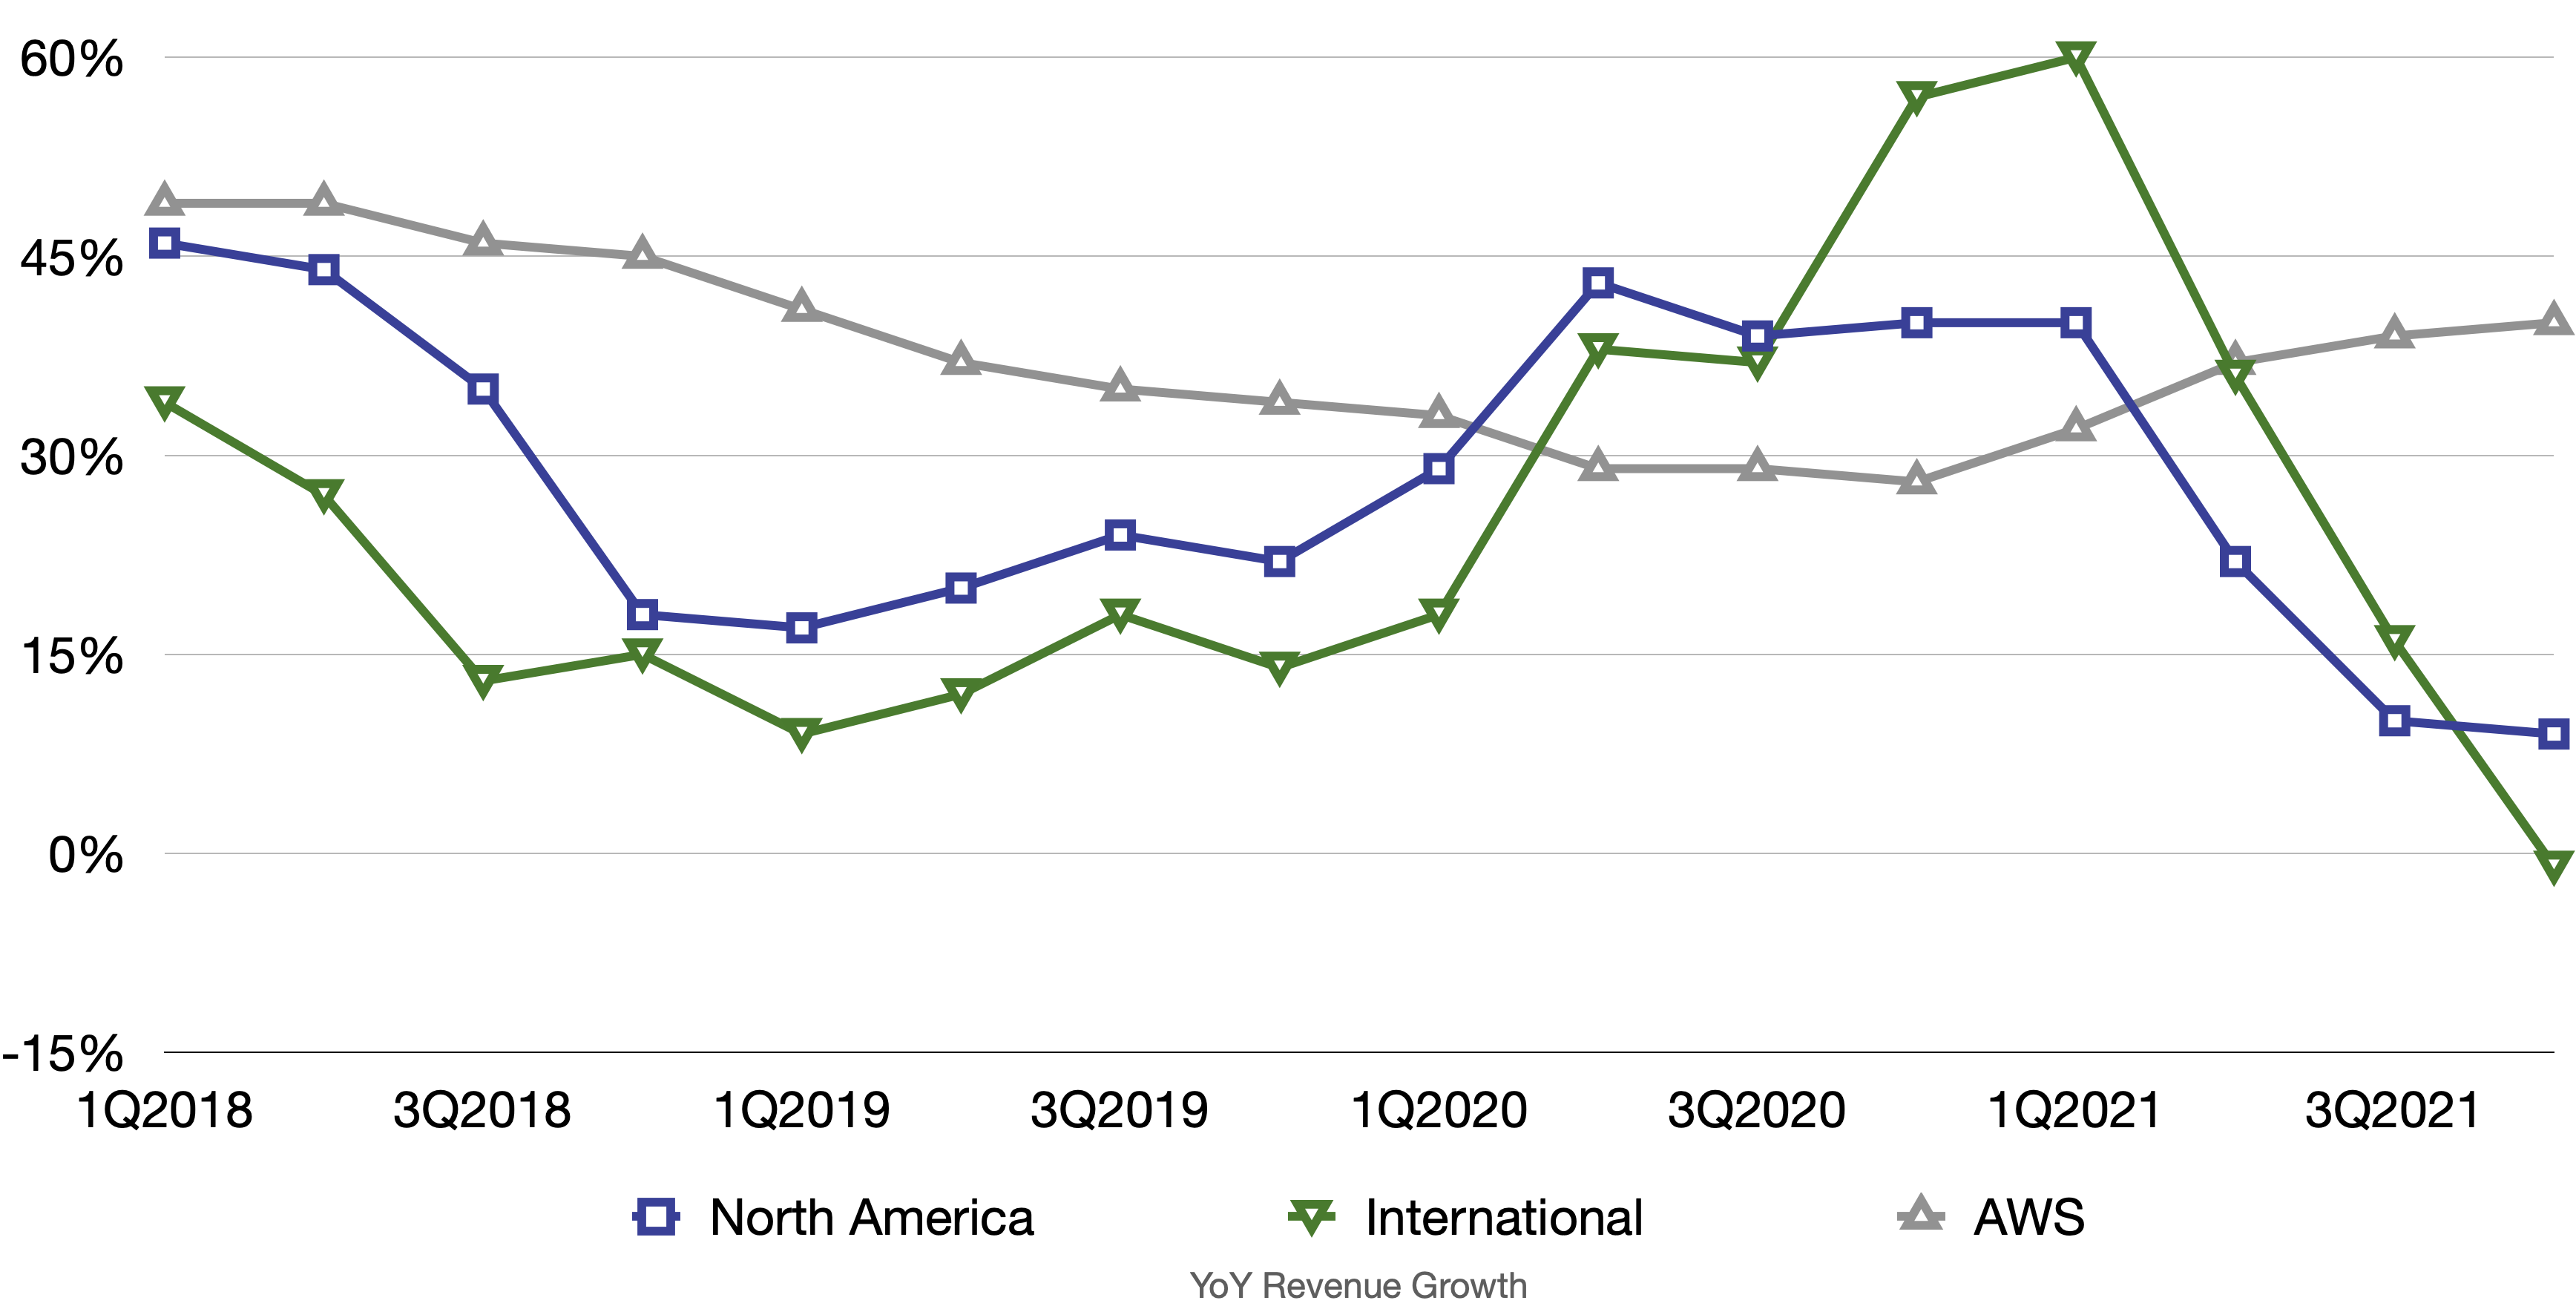
North America and International have seen decreasing growth for the last three quarters. International even contracted in Q4 FY2021. AWS is impressive
Online Stores contracted modestly in Q4 FY2021

Negative TTM Free Cash Flow

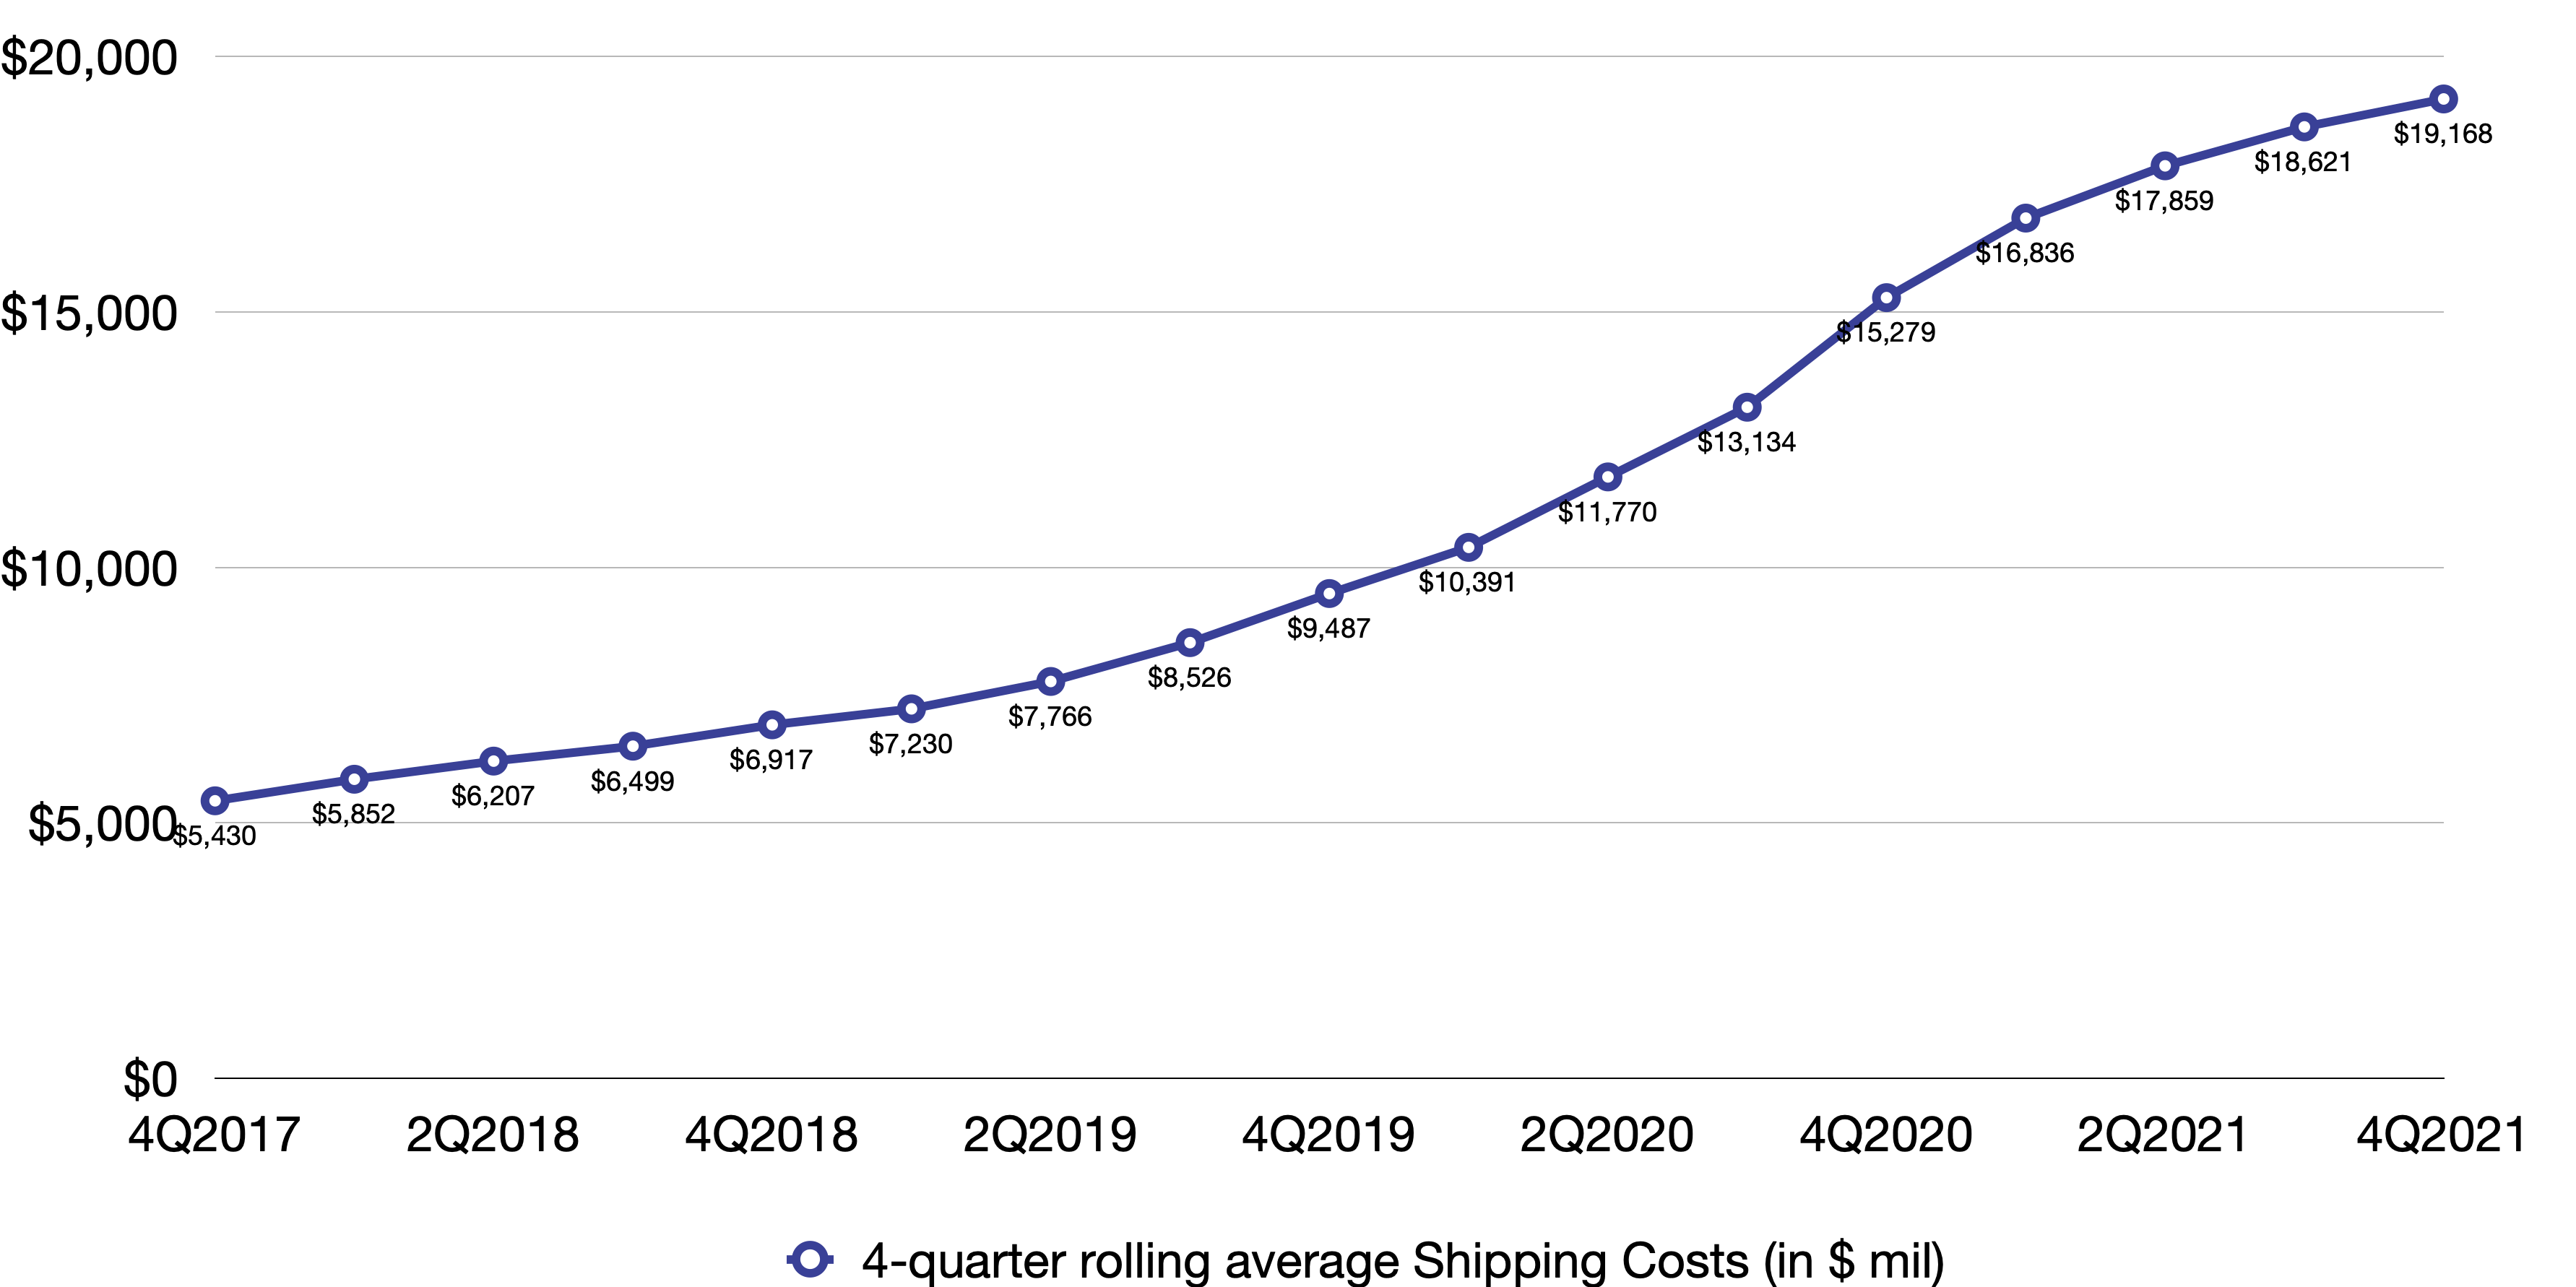
Amazon spent $72 billion in shipping costs in 2021. It crossed $20 billion a quarter mark in Q4 2021
Amazon spent more than $13 billion in Video and Music expenses


Leave a comment